Saturday, 21 July 2012


People can learn a lot about life by observing nature's creatures, observations that can benefit every aspect of someone's life. Let us examine a cougar and how it hunts for prey. The cougar is one of nature's fiercest creatures. When hunting for prey, a cougar is strategic. If a cougar fInds a herd of deer, it will wait patiently observing the entire herd looking for the weakness within the herd. The reason for this is that the cougar can only run at top speed for short distances. Therefore, it is imperative to get as close to its prey as possible before making a killing strike. Otherwise, the opportunity will be lost and it may be some time before the next one appears.

The more days that the cougar goes without food, the slower it will be able to run, thus making it harder and harder to attack its prey.


So why are we talking about cougars?


Playing the market is very much like the cougar's hunt for prey. Whether you are trading the Forex market, the Futures market, the Options market, the Equities market, and so forth, you must have a plan before entering each trade. If you do not, it will be harder and harder to find Opportunities because each lost opportunity will take a toll mentally, physically, and psychologically on your well-being.

Therefore, you must observe the instrument greatly before executing a trade. A trader observes the instrument patiently until an opportunity is seen. Once an opportunity is present, a plan is executed. Someone once told me "Trading is neither logical nor predictable." After years of trading, I can honestly say that statement is completely true. It is a probability game, You have to have a system to help increase your probability of success or you are just gambling. By rolling a dice, a person has a probability of 50 percent on the desired outcome. Therefore, one of our goals is to trade with a higher probability of success than 50 percent. How do you do that? This can be achieved by creating a trading system that maximizes profits when you are right and minimizes losses when you are wrong (i.e., 
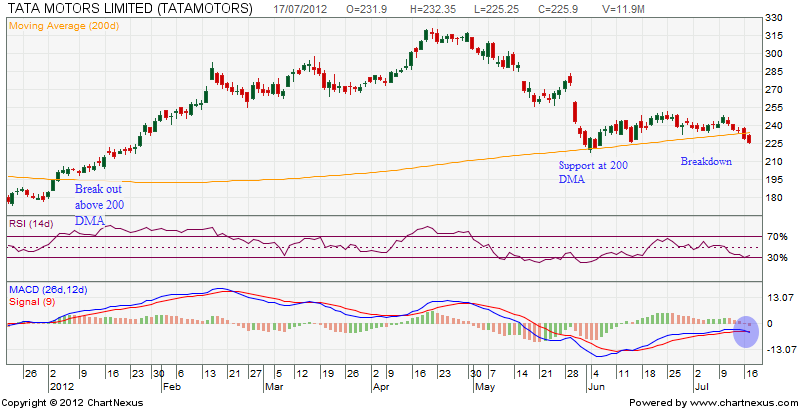
play trends instead of consolidation patterns). A trend is when price goes in a certain direction for a long period of time whereas a consolidation pattern is where price goes "back and forth" among a range of prices. As told by Manish Patel in his book Ichimoku trading system

Thursday, 19 July 2012

Market update for 20/07/2012


Nifty hourly chart


Today's trading session is a range bound session. We are still in a tight range of 5190-5260. Nifty spot made a day high of 5258 but was not able to cross 5260. Option buyers should be cautious as there are very few trading sessions left before expiry. Maruti , SBI , Hero Moto , Kotak Bank were the major losers among the index stocks. Maruti is a falling knife don't try to catch it. Most of us try to buy those which are falling continuously assuming that it will bounce back which may not happen immediately.

Long positions in Nifty can be entered if Nifty sustains above 5260 minimum target is 5300 . Stop loss below 5190.(Spot levels).

Chart of the day

JSW Steel


Today metal sector was one of the top gainer. Stocks like JSW steel , Sesa Goa , Tata Steel have performed well. The prices of base metals in international market has increased which is positive for metal stocks.

JSW steel has taken support at 200 DMA as well as an ascending trend line and today stock has bounced back. JSW steel closed at Rs.689.50 up by 2.5%.Stochastics is in oversold region indicating that downside is limited. This stock has the potential to reach Rs.720 .

Open Positions


Scrip Type Qty  Price CMP P/L
JSW Steel Long 60 691 689 -120
Bajaj Auto Long 20 1491 1548 1140
Minifty Aug fut short 20 5216 5280 -1280

Today's Trade


Scrip Qty Buy Price Sell Price P/L
LT 1400 CE 250 37 22.35 -3662
Bajaj Auto 20 1491 1559 1360
Tata Mot 230 CE 1000 2.05 2.4 -350

Nifty Medium term trend


Trend  Up
Initiation Date 12/06/2012
Initiated at  5116
High since change 5345
Reversal if closes below 5120


Thought for the day


In order for you to succeed,  your desire for success should be greater  than your fear of failure.


Wednesday, 18 July 2012

Market update for 19/07/2012


Nifty hourly chart


Today's trading session was volatile one. Nifty made a day low of 5170 and sustained for some time. But closing happened at 5216 up by 23 points which has trapped the bears. Unless Nifty closes below 5190 we cannot expect further fall in the market. 5190-5260 will be short term range and we may not notice a sustainable breakout in this series.

Chart of the day


Bank Nifty


Bank Nifty is taking a trend line support . If Bank Nifty closes below 10500 then short position can be initiated.Otherwise we can expect a bounce back.

Open Positions 


Scrip Type Qty  Price CMP P/L
LT 1400 PE Short 250 22.35 28.7 -1587
Tata Mot 230 CE Short 1000 2.05 1.75 300
Bajaj Auto Long 40 1491 1521 1200
Minifty Aug fut short 20 5216 5245 -580


Today's Trade

Scrip Qty Buy Price Sell Price P/L
Minifty Aug fut 20 5216
Bajaj Auto 40 1491


Medium term trend


Trend  Up
Initiation Date 12/06/2012
Initiated at  5116
High since change 5345
Reversal if closes below 5120


Thought for the day


Care about what other people think  and you will always be their prisoner - Lao Tzu


Nothing is more exciting then getting into a trade that blasts off and puts you into a highly profitable situation. This can cause major problems however, because this type of trade puts you in a highly euphoric state and leads to daydreaming about the huge profits still to come. The real problem occurs as you get caught up in the daydream and expectations. This causes you to not be prepared to get out as the market reverses and wipes off all your profits because you have convinced yourself of the eventual outcome and will deny the reality of the situation. The simple remedy for this is to know where and how you will take profits once you enter the trade.

Tuesday, 17 July 2012

Market update for 18/07/2012


Nifty hourly chart


Today's trading session was a choppy one. Nifty has closed at 5192 down by 4 points. Nifty is again and again testing 5190 levels and bouncing back. In hourly chart Nifty has closed below 5190 but managed to bounce back in the last few mins. The important support at 5190 will eventually  become weak .  Wait for a close below 5190 to initiate new short positions.

Nifty Daily chart


There is no significant change in daily chart. The indications of negative trend like breakout from wedge , Sell indication from MACD , close below 20 DMA has remained the same.Reversal of the trend can happen above 5260. Traders should observe that many index shares are cracking. Bajaj Auto, LT, Tata Mot, large cap IT companies to name a few. It is advisable to avoid positional long position at this point of time.


Chart of the day


Tata Motors


Tata Motors was one of the outperforming stock when Nifty was at 5600 before few months. It is in downtrend from few weeks and now fresh shorting opportunity has appeared. In the above chat you can observe that Tata Motors breached 200 DMA at Rs. 195 on 4/1/2012. Since then it was bullish. Even though retracement happened Tata Motors took support at 200 DMA twice at Rs.220 and Rs.224. From past two trading session it is trading below 200 DMA indicating that this stock has entered bearish phase from short term and medium term point of view. Traders can take short for a target of Rs.215-200 and reversal can happen if it closes above Rs.234.

Open Positions


Scrip Type Qty  Price CMP P/L
LT 1400 PE Short 250 22.35 18.95 850
Tata Mot 230 CE Short 1000 2.05 2.05 0

Today's Trades


Scrip Qty Buy Price Sell Price P/L
Bharti 420 CE 1000 2.75 7 -4250
Nifty Fut 50 5250 5201 2450
Nifty 5300 CE 50 45 17 -1400
Tata Mot 230 CE 1000   2.05  
Bharti  150 326 327 150


Nifty Medium Term View


Trend  Up
Initiation Date 12/06/2012
Initiated at  5116
High since change 5345
Reversal if closes below 5120


Results

Bajaj Auto , Crisil

Thought for the day


Life is really simple but we insist on making complicated - Confucius