Thursday, 11 October 2012


Market updates for 12/10/2012


Nifty daily chart


Nifty has made a sharp bounce back from the support at 5630. 20 DMA is at 5650 levels and until these two levels are broken further fall cannot be expected. On the higher side 5720 is the resistance. Sustainable uptrend can be expected above 5780. Above 5780 target will be 5815-5850-5950. On the other hand below 5630 target will be 5580-5500. The short term trend will remain down.


Important events :  Quarterly result of Infosys , HDFC Bank, IIP data
 

Chart of the day

 Tomorrow Infy and HDFC bank are announcing quarterly result. Lets look into the chart pattern to identify the best entry points. Traders should note that the entry points mentioned here are not for intraday trading.
 

Infy


Last three quarterly result of Infy was below expectation and on the day of result the stock corrected by nearly 10%. Technically Infy is weak as it is trading below 200 DMA an also it has breached important channel support. Immediate support is at 2460 and resistance is 2647. Breakout from this range can take Infy to 2737 or 2330. Tomorrow Infy will be highly volatile so day traders should be highly cautious.


HDFC Bank


HDFC Bank is facing resistance at Rs.638 and major support is at Rs.600. Long position can be considered if it closes above Rs.638 for a target of Rs.675 and below Rs.600 target will be Rs. 580-560.
 

Nifty medium term trend

 
Trend  UP
Initiation Date 08-07-12
Initiated at  5336
High since change 5815
Reversal if closes below 5580


Open Positions

 
Scrip Type  Price CMP P/L
Bank Nifty Fut Short 11422 11549 -127
Bank Nifty 11400 PE Long 204 280 76


Thought for the day

 
 He who ask a question is a fool for a minute he who doesn't ask is a fool for ever.


Wednesday, 10 October 2012


Market updates for 11/10/2012


Nifty daily chart


Today's trading session was dominated by bears. Real Estate and Banks were top losers. Nifty shut shop at 5652 down by 52 points.
 
In daily chart Nifty has continued to show weakness and now it is heading towards support level at 5360-5600 levels. If Nifty sustains below 5600 then then it may test 5500 which is 50% retracement of the rally from 5214 to 5815. Long term trend will remain up and Nifty is expected to form higher high higher low.
 

Chart of the day


Bank Nifty


Bank Nifty has just started its down trend. It has closed below 11300 , momentum indicators like MACD and RSI are indicating sell. More details for subscribers.
 

Nifty medium term trend

 
Trend  UP
Initiation Date 08-07-12
Initiated at  5336
High since change 5815
Reversal if closes below 5580


 Open Position

 
Scrip Type  Price CMP P/L
Bank Nifty Fut Short 11422 11338 84
Bank Nifty 11400 PE Long 204 171 -33


Thought for the day

 
Holding a grudge is letting someone live rent free in your head.


Tuesday, 9 October 2012


Market updates for 10/10/2012


Nifty daily chart


Nifty has bounced back after a fall of 100+ points from the peak 5815. A bounce back of 28 points will not change the down trend of Nifty. MACD has indicated sell and so the possibility of reaching 5630 is quite high. Sustainable uptrend will start only above 5780. Till then sell on rallies.
 

Chart of the day


DLF


DLF is the largest loser in recent trading sessions. Stock was down by 7% after Mr.Arvin Kejriwal exposed the association of Mr.Robert Vadra with DLF. Many questions are there in the minds of investors about corporate governance of this company and the questions are unanswered.
 
DLF has major support at Rs.220 and any breakout from this level should be used to create new short position.


Nifty medium term trend

 
Trend  UP
Initiation Date 08-07-12
Initiated at  5336
High since change 5815
Reversal if closes below 5580
 

Open Positions

 
Scrip Type  Price CMP P/L
Bank Nifty Fut Short 11422 11490 -68
 

Thought for the day

 
Constantly choosing lesser of two evils is choosing evil itself.


Monday, 8 October 2012


Market updates for 09/10/2012


Nifty daily chart


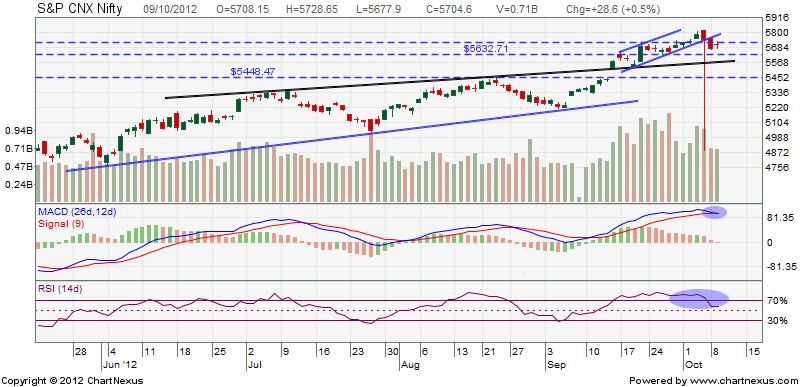
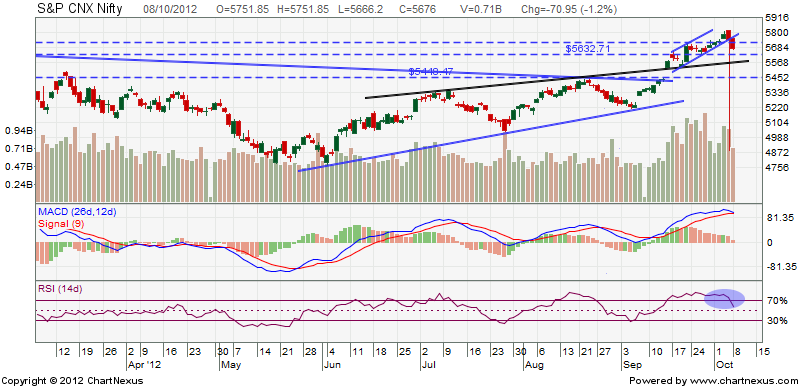
Nifty has started short term down trend by closing below 5700. Now the expected short term target is 5630 and if Nifty closes below this level then next target will be 5550. If Nifty makes flat to negetive close for one more day then MACD will indicate sell which will act as further confirmation of downtrend.
 

Charts of the day


Crude Oil


Crude Oil has taken trend line support around 4650 levels and now it is consolidating between 4600-4720. RSI is oversold and consolidation is likely to continue for some more time. If it closes below Rs.4600 then downtrend will resume.


Tata Motors


Tata Motors was one of the top loser in today's trading session. The trend remains up as it has formed an ascending channel. Rs.272 is the trend line support and any breakout from this level will take Tata Motors to Rs.258.
 

Nifty Medium Term Trend

 
Trend  UP
Initiation Date 08-07-12
Initiated at  5336
High since change 5815
Reversal if closes below 5580
 

Open Positions

 
Scrip Type  Price CMP P/L
Tata Motors Fut Long 281.5 272.4 -9.1
Tata Motors 280 PE Long 9.3 13.9 4.6
Coal India Long 364 360 -4
Bank Nifty Fut Short 11422 11418 4


Thought for the day

 
People take different roads sseeking fulfillmet and happiness. Just because they are not on your road doesn't meaan that they have gotten lost - Dalai Lama

Friday, 5 October 2012


Market updates for 08/10/2012


Chaos in Market

 
Today at one point of time there was chaos in  market as well as in the minds of traders as Nifty's day low is 4888!!. Here is the news reported by www.moneycontrol.com
 
The National Stock Exchange index Nifty crashed 800 points this morning, halting the trade, which the bourse blamed on erroneous orders worth Rs 650 crore by a broker Emkay Global for one of its clients.
The NSE said it is investigating the matter and the abnormal orders that resulted in multiple trades at low prices. In a statement after the incident, which halted the trade in cash markets for about 15 minutes, NSE said, "The market circuit filter got triggered due to entry of 59 erroneous orders which resulted in multiple trades for an aggregate value of over Rs 650 crore. "These orders have been entered by a trading member Emkay Global Financial Services on behalf of an institutional client. "These non-algo market orders have been entered for an erroneous quantity which resulted in executing trades at multiple price points across the entire order book thereby causing the circuit filter to be triggered. These orders have been identified to a specific dealer terminal," it added. On the other hand, BSE said the market at the exchange was working fine and there were no technical or other issues at the bourse. However, the BSE index Sensex also fell by about 200 points in reaction to the plunge in Nifty, as there are many common stocks on the two indices.
 The incident occurred on a day when expectations were high for a sharp upward rally on the bourses following various reform measures approved by the Union Cabinet last evening, including on FDI in insurance and pension sectors. At 1220 hours, the markets recovered some lost ground and Sensex was trading 177 points down at 18,880.98 points. The Nifty was down 58.35 points at 5,729.25 points. Earlier in the morning, Nifty had fallen sharply by about 800 points or 16 per cent to a low of 4,997.6.


Nifty daily chart


Most of us were expecting a big rally in the market. But Nifty has closed at 5746 down by 40 points. As long as Nifty is above 5700 let us not short Nifty. RSI is overbought but MACD has not indicated sell so far. There are possibility that Nifty can trade between 5700 to 5800. Breakout on either  side should be used to create long/short positions.
 

Nifty weekly chart


In weekly chart 123.6% is at 5840. In this week Nifty has reached a high of 5815 and in coming days it is expected to reach 5840-5965. As per Fibonacci retracement in weekly chart medium term trend will remain up as long as Nifty is above 5630. Any dip towards these levels should be considered as buying opportunity. 


Chart of the day


Axis Bank


Buy recommendation was given in Axis Bank at Rs.1155 and expected target was Rs.1175( futures). On Thursday's trading session it was a top gainer. There was a gap between Thursday's closing price and trend line resistance and expectation was that it will be filled. Axis Bank fut made a high of Rs.1168 and there was a sharp decline. As long as Axis Bank is below Rs.1165 long position will not be considered.


Nifty Medium term trend

 
Trend  UP
Initiation Date 07/08/2012
Initiated at  5336
High since change 5815
Reversal if closes below 5580


Open Positions

 
Scrip Type  Price CMP P/L
Tata Motors Fut Long 281.5 282.5 1
Tata Motors 280 PE Long 9.3 9.1 -0.2
Coal India Long 364 363.5 -0.5


Position squared off


Scrip Buy Price Sell Price P/L
Axis Bank Fut 1155 1146 -9
Axis Bank 1150 PE 44 46 2
BHEL 249.5 260 10.5


Thought for the day

 
Don't worry that you are not strong enough before  you begin. It is in the journey that god makes you strong.