Sunday 30 December 2012


Market updates for 31/12/2012


Nifty daily chart


Nifty is in a consolidation mode from past 1 month and breakout is expected to happen in one or two trading sessions.
 
Whole world is closely watching developments about ' Fiscal Cliff' and the impact will be known on Tuesday morning that is on 1/1/2013. So don't hold too many positions. Traders can consider initiating position based on direction of breakout.
 

Nifty weekly chart


From past one month Nifty has failed to break barrier at 5950. Breakout from this level on daily or weekly basis will take Nifty to 6150.
 

Copper daily chart


Copper is consolidating between 441-438. It has resistance at Rs.442 and if it sustains above this level then it can reach Rs.447.
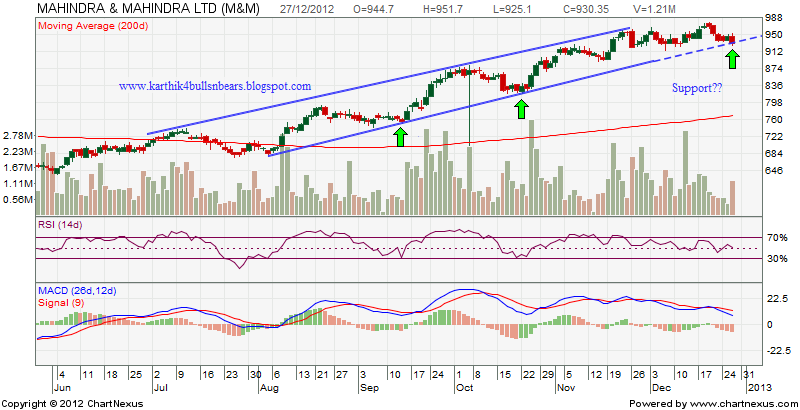
 

M&M weekly chart


M&M has exactly closed at support in Weekly chart. A weekly close below Rs.925 will lead to further fall in stock price. Wait for breakout.
 

Nifty medium term trend

 
Trend  UP
Initiation Date 29-11-12
Initiated at  5825
High since change 5950
Reversal if closes below 5680


Thought for the day

 
It is true that even across the Himalayan barrier India has sent to us such unquestionable gifts as grammar and logic, philosophy and fables, hypnotism and chess, and above all our numerals and our decimal system. But these are not the essence of her spirit; they are trifles compared to what we may learn from her in the future.~ Will Durant (American philosopher)


Thursday 27 December 2012


Market estimates for 28/12/2012


DJIA


After testing resistance at 13300 Dow Jones in in down trend. It is likely to test 13000 in short term where 200 DMA is situated.
 

M&M


M&M is one of the top performers in this rally. It is moving in a ascending channel and today it has reached an important trend line support. Since overall direction of the market is bullish it is likely to bounce. However if it closes below the trend line resistance then it is likely to fall further.
 

Nifty medium term trend

 
Trend  UP
Initiation Date 29-11-12
Initiated at  5825
High since change 5950
Reversal if closes below 5680


Thought for the day

 
India conquered and dominated china culturally for 20 centuries without ever having to send a single solider across her boarder - Hu Shih (Chinese Ambassador to USA)
 

Wednesday 26 December 2012


Market estimates for 27/12/2012


Nifty daily chart


Nifty has once again bounced back from the support at 5840 and closed at 5905. Since 5840-5950 is the trading range , now it is likely to test 5950. Positional traders should avoid trading in Nifty till breakout happens. If Nifty closes above 5950 then expected target is 6050. As the short term and medium trend of Nifty is up I am expecting breakout on upside. Lets wait and watch.
 

Bank Nifty daily chart 


Bank Nifty is also consolidating in a narrow range that is between 12230-12550. If it closes above 12550 then expected target is 12800.
 

Nifty medium term trend

 
Trend  UP
Initiation Date 29-11-12
Initiated at  5825
High since change 5950
Reversal if closes below 5680


Thought for the day

 
India is the cradle of human race , the birth place of human speech , the mother of history , the grand mother of legend and great grand mother of tradition. Our most valuable and most artistic materials in the history of man is treasured in India - Mark Twain (American Writer)


Sunday 23 December 2012


Market estimates for 24/12/2012


Nifty daily chart


Nifty has once again tested 5840 support . From past few days Nifty is trading between 5840-5950 and we need a breakout to enter into a high probability trade. RSI is around 50 indicating that further downside that is till 5700 is possible. Traders can consider if Nifty sustains below 5820.
 

Nifty weekly chart


From past 3 weeks Nifty is unable to break 5950 resistance . Nifty is expected to go down till 5700 before resuming uptrend. Since Nifty is forming higher high , higher low it might break 5950 in next cycle. This formation will change if Nifty breaks 5700 on lower side .
 

Charts of the day


LT


LT was one of the top losers on Friday's trading session. It has breached an important support at Rs.1600 (red colour trend line) . It is expected to go down further.
 

HDFC Bank


This is the weekly chart of HDFC Bank. After breaking trend line resistance at Rs.660 it made a high of Rs.700. Now it has closed at trend line support and if it closes below this trend line support on weekly basis further fall is expected.
 

Nifty medium term trend

 
Trend  UP
Initiation Date 29-11-12
Initiated at  5825
High since change 5950
Reversal if closes below 5680


Thought for the day

 
If I were asked under what sky the human mind has most fully developed some of its choicest gifts  , has most deeply pondered on greatest problems of life and has solutions I should point to India - Max Muller (German Scholar)
 

Thursday 20 December 2012


Market updates for 21/12/2012


Metal Sector Stocks

 
There are breakouts in Blue Chip metal sector companies. So today's updates is only about Metal stocks.
 

Tata Steel


Hindalco


JSW Steel


In the above charts you can see that Tata Steel and Hindalco has breached resistance and further uptrend is expected. On the other hand JSW Steel has reached important resistance level. Tomorrow is the last trading day of  week and lets see the closing.
 

Nifty medium term trend

 
Trend  UP
Initiation Date 29-11-12
Initiated at  5825
High since change 5950
Reversal if closes below 5680


Thought for the day

 
When I read Bhagavad Gita and reflect about how god created this universe everything else seems so superfluous - Albert Einstein
 

Wednesday 19 December 2012


Market estimate for 20/12/2012


Nifty daily chart


Nifty has continued its uptrend and today it made a high of 5939. It can face resistance at 5950 and once this level is breached we can expect a target of 6000-6150-6300. Of course all these targets will not be reached within a day or two. Wait for breakout above 5950 (spot).
 

Madras Cement


Madras Cement is in a bull run from past 6 months and today it breached previous high at Rs.220. We have initiated long at Rs.211 and continuation of the trend is expected.
 

Silver


Silver is looking weak in daily chart . It has formed lower high formation and support is around Rs.60,000. Further fall is expected if breakout from this level happens. Lets see.
 

Nifty medium term trend

 
Trend  UP
Initiation Date 29-11-12
Initiated at  5825
High since change 5950
Reversal if closes below 5680
 

Thought for the day

 
Man is only partially satisfied in his attempt to have the fulfilment of his desires. And this partial satisfaction fans and increases the flame of craving instead of extinguishing it . So greed always finds an endless field of  conquest and leaves the man endlessly dissatisfied - Meher Baba


Tuesday 18 December 2012


Market estimates for 19/12/2012


JSW Steel


In yesterday's post analysis of JSW Steel was uploaded and as expected it not only reached Rs.790 but also surpassed the target and made a high of Rs.814. I hope you all have enjoyed the profit. Further upside is expected.
 

REC


REC is one of the top gainers in today's trading session. The stock was up nearly by 5%. It has closed at a critical resistance level. Wait for breakout to initiate long position.
 

Commodity Chart


Lead


Lead has breached trend line support at Rs.125 and at this point of time it is trading at Rs.126.20. We are bullish on lead from short term point of view.


Nifty medium term trend

 
Trend  UP
Initiation Date 29-11-12
Initiated at  5825
High since change 5950
Reversal if closes below 5680
 
 
I always say to my clients not to depend on 'News'. But few traders are able to understand the point. Today there was an expectation that RBI will cut CRR but that didn't happen. So Nifty started falling but later on it made a bounce back and closed at 5894 up by 36 points. Trade according to time tested method.


Thought for the day

 
There is neither past nor future . There is only present . Yesterday was the present to you when you experienced it , and tomorrow is the present when you experience it. Therefore experience exists only in the present and beyond experience nothing exists - Ramana Maharshi


Monday 17 December 2012


Market estimates for 18/12/2012


Nifty hourly chart


Nifty has support around 5640 level. If this level is breached then we can expect fall up to 5800-5780 levels. 5885-5900 are the resistance levels above which Nifty can reach 5950. So short term range of the Nifty is around 5800-5900.

Madras Cement


Madras Cement has made a major rally from past 6 months. From past few trading sessions it is facing resistance at Rs.220. Breakout from this level should be used to create new long positions.


JSW Steel


JSW Steel is one of those stocks which are forming higher top , higher bottom formation. Last week it has taken support at trend line and today made a sharp bounce back. This bounce is expected to continue till Rs.790.
 

Tech Mahindra


In yesterday's post I had indicated breakout in Tech M. Even though it made an intraday low of Rs.925 closing was at Rs.952.70. As long as it is above Rs.940 position will remain open.
 

Nifty medium term trend

 
Trend  UP
Initiation Date 29-11-12
Initiated at  5825
High since change 5950
Reversal if closes below 5680
 

Thought for the day

 
If failure has has the strength to turn your life into bitterness itself , then patience has the strength to turn your life into sweetest joy. Do not surrender to fate after single failure . Failure at most precedes success - Swami Chinmoy


Sunday 16 December 2012


Market estimates for 17/12/2012


Nifty daily chart


Nifty has bounced back from 5841 and closed at 5870. The short term trading range could be between 5840-5900. Breakout from 5840 will take Nifty to 5800-5780. In worst case scenario Nifty can fall to 5700 which is the strong base for Nifty.


Nifty weekly chart


Nifty is facing strong resistance at 5950 which is 78.6% retracement. If Nifty closes above this level on weekly basis then Nifty can reach 6180-6300.


Chart of the day


Tech Mahindra


Tech Mahindra has made break out from the channel. Traders can enter long in Tech M for a target of Rs.996. Stop loss close below Rs.940.
 

Nifty medium term trend

 
Trend  UP
Initiation Date 29-11-12
Initiated at  5825
High since change 5950
Reversal if closes below 5680


Thought for the day

All losses in market are entire attributable to not investing with the primary trend.


Thursday 13 December 2012


Market updates for 14/12/2012


Nifty hourly chart


In yesterday's post it was mentioned that there is a slow down in momentum and break out below 5875 will teke Nifty to 5840 . Refer previous post http://karthik4bullsnbears.blogspot.in/2012/12/dear-traders-i-have-started-conducting.html . Today Nifty made a low of 5841. There is room for further correction. Expected targets are 5810-5760-5740 (spot levels) .
 

Nifty Daily Chart 


Nifty is showing signs of exaution in hourly as well as in daily chart. RSI is overbought and showing signs of possible short term dip. It has  major support around 5740 which is likely to be tested. Reversal will be above 5900.
 

Chart of the day


SBI


SBI is one  of the out performer in the recent rally. It has made a rally of around 250 points. t has formed multiple tops around Rs.2250 breakout from this level will leed to fall towards 2200 and much below. However today we have created bearish position based on trend indicators. Lets see !


Nifty medium term trend

 
Trend  UP
Initiation Date 29-11-12
Initiated at  5825
High since change 5950
Reversal if closes below 5680


Thought for the day

 
We can gain experience from the past but we cannot relive it.  We can hope for the future but we don't know if there is  one.


Wednesday 12 December 2012


Dear Traders,

I have started conducting  on line discussion about 'Risk Management in Trading' .  Good news is it will be free. If you are interested to participate call me on 08197190791.

Market updates for 13/12/2012


Nifty hourly chart


Nifty has become flat from few trading sessions. After a rally of 400 points this contraction is obvious. RSI is showing signs of divergence and if Nifty sustains below 5875 (spot) then it may go down till 5840.


Chart of the day


BHEL


BHEL made a break out from resistance at Rs.240  and reached a high of  Rs.248. But this breakout was not sustained and now it has closed below the support and 20 DMA. It is expected to correct further.


Nifty medium term trend

 
Trend  UP
Initiation Date 29-11-12
Initiated at  5825
High since change 5950
Reversal if closes below 5680
 
 
To follow on twitter click on www.twitter.com/karthik4ta


Thought for the day

 
All the powers in the universe is already ours. It is we who have put our hands before our eyes and cry that it is dark. Swami Vivekananda


Tuesday 11 December 2012


Market updates for 12/12/2012


Tata Motors


Tata Motors is facing resistance around Rs.285. Wait for breakout above Rs.285 for continuation of up trend. It has trend line support around Rs.266 which can act as low risk entry level.
 

Bharti Airtel


Bharti Airtel had breached trend line resistance and reached a high of Rs.340. But now it has closed below the trend line support and oscilators like MACD and RSI are indicating sell. We have initiated short in Bharti at Rs.319 today it has closed at Rs.316 further fall is expected.


Nifty medium term trend

 
Trend  UP
Initiation Date 29-11-12
Initiated at  5825
High since change 5950
Reversal if closes below 5680
 

Thought for the day

 
He alone is entitled to be called a man who possess a thoughtful nature and feel for others in the same way as he does for his own self , does not fear unjust , however powerful , but fears the truly virtuous , however weak. - Dayananda Saraswati 


Monday 10 December 2012


Market updates for 11/12/2012


Nifty daily chart


Nifty is consolidating in a narrow range. We cannot expect continuation of uptrend unless it breaks 5950 on closing basis. RSI is in extreme over bought position. However the disadvantage of RSI is that it can remain over bought for longer than expected time in a perfect trending market.
 
Wait for break out.
 

Chart of the day


TCS


TCS has breached 200 DMA as well as support at Rs.1260. It is forming lower high lower low which is a bearish formation. Further downfall is expected.


Nifty medium term trend

 
Trend  UP
Initiation Date 29-11-12
Initiated at  5825
High since change 5950
Reversal if closes below 5680


Thought for the day

 
India of the ages  is not dead nor she has spoken her last creative word : she lives and has still something to do for herself and to the human beings - Maharshi Aurobindo.


Sunday 9 December 2012


Market updates for 10/12/2012


Nifty weekly chart


In the previous posts it was mentioned that Nifty is likely to reach 5950 . Now it has completed 78.6% retracement. Earlier Nifty has made a peak at 5950 in April 2011 which can act as intermediary resistance. RSI is in over bought position and there could be possibility of a short term correction. If market corrects, then in worst case scenario, it may come down to 5700 which is trend line support. If Nifty sustains above 5940 then it will move towards 6000-6300.
 
Overall direction of Nifty from short term and medium term perspective remains bullish. Short term reversal is below 5780 and medium term reversal is below 5685.

Chart of the day


BHEL


BHEL has made multiple peaks at 240 and it has breached this level and sustained for 2 trading sessions. Also it is trading above 50 MA and momentum indicator is showing uptrend. We have initiated bullish strategy at Rs.241.


Lead


Lead faced resistance at Rs.123.2 and started falling. It has closed below Rs.121 which is 20 DMA and MACD is indicating sell. Based on above observation we have created short position at Rs.120. The reversal of the trend will be closing above Rs.123.20.
 

Nifty medium term trend

 
Trend  UP
Initiation Date 29-11-12
Initiated at  5825
High since change 5950
Reversal if closes below 5680


Thought for the day

 
Men occasionally stumble over the truth , but most of them pick themselves up and hurry off as if nothing has happened.