Market updates for 02/01/2013
SBI Daily Chart

SBI was one of the top performer in today's trading session as it was up by 1.7%. The significant development in daily chart of SBI is it has breached trend line resistance at Rs.2420. Further upside is expected.
LT Daily chart
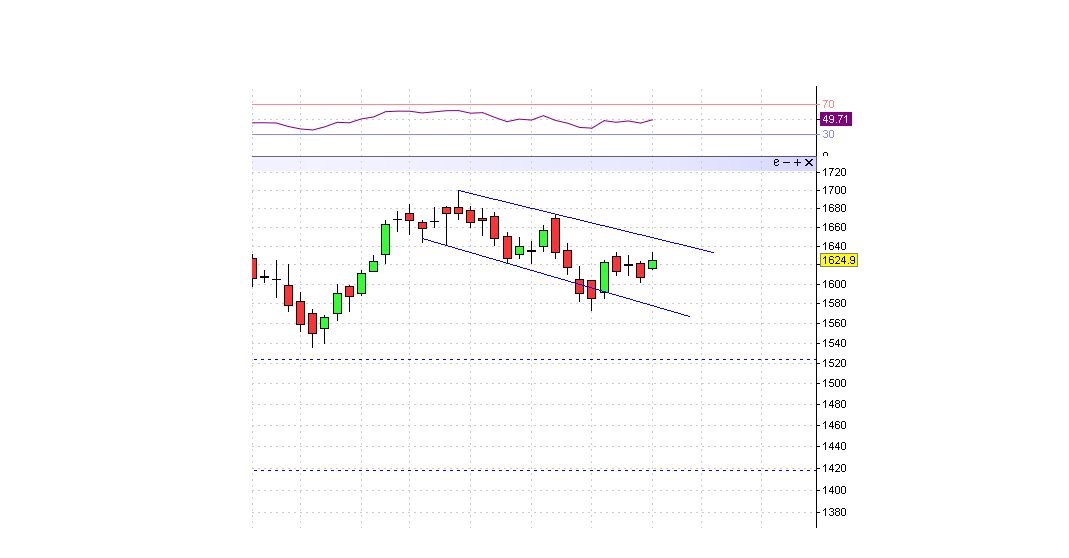
LT is trading within in a channel. Support is around Rs.1600-1580 and resistance is around Rs.1640. Breakout from Rs.1640 will take LT to much higher levels.
Nifty Monthly Chart

Nifty is moving in a ascending channel. A trend line in monthly chart is drawn by joining 5177 and 5630 (marked in circles) and this trend line resistance at 6100 can act a major resistance in coming days. So one argument will be rally from 6100-6300 may not be an easy one. On the other hand we may also think that since lot of money is flowing into Indian market from FIIs this trend line might be breached. Lets see !!?
Nifty medium term trend
| Trend | UP |
| Initiation Date | 29-11-12 |
| Initiated at | 5825 |
| High since change | 5960 |
| Reversal if closes below | 5680 |
Thought for the day
Tell me, why is the media here so negative? Why are we in India so embarrassed to recognise our own strengths, our achievements? We are such a great nation. We have so many amazing success stories but we refuse to acknowledge them. Why?
~~~ Abdul Kalam
~~~ Abdul Kalam