Market update for 01/08/2012
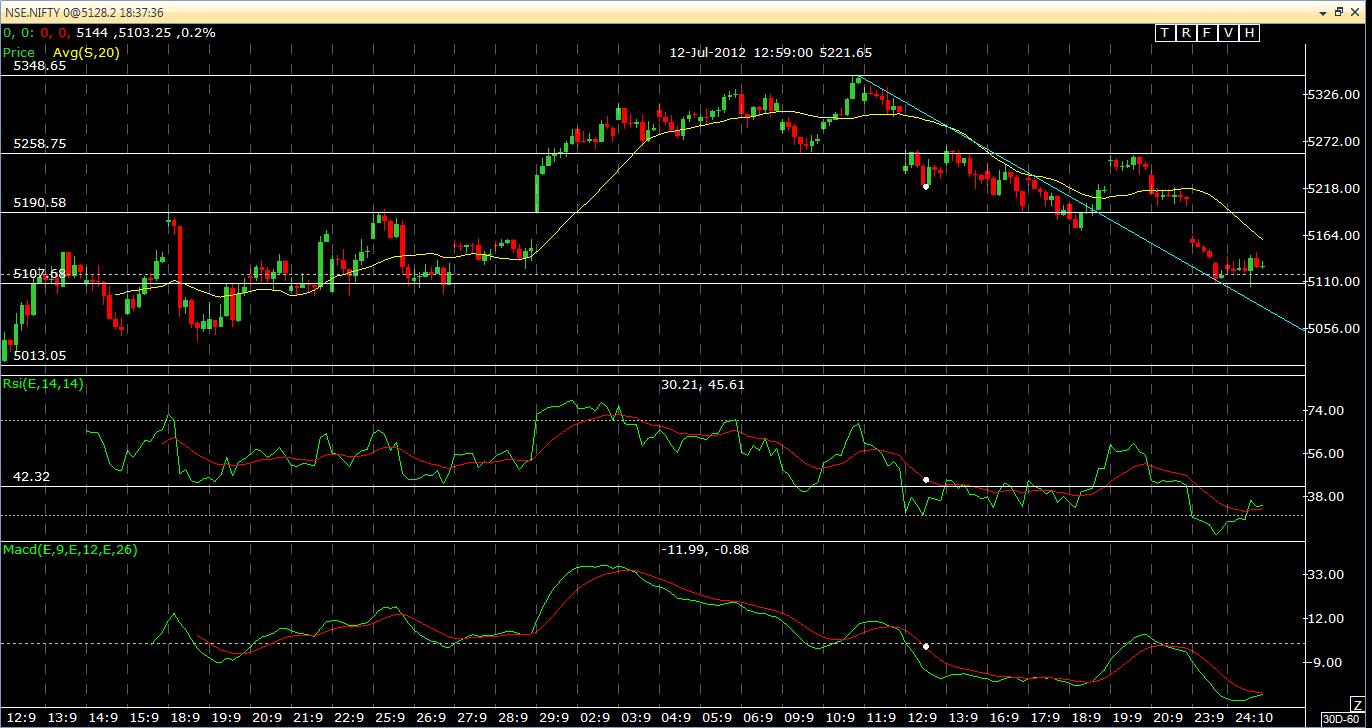
Nifty hourly chart

Today's trading session was very volatile as RBI has announced monetary policy. Repo , Reverse Repo and CRR are unchanged but SLR ( Statutory Liquidity Ratio) was reduced http://lastbull.com/what-is-statutory-liquidity-ratio-slr/. Interest rate sensitive sectors like Banks , Auto and Real Estate were highly volatile and many companies in this sector have closed in green. Nifty closed with moderate gain at 5229 up by 29 points. Short term trend remains up and the expected targets are 5250-5300.
Nifty daily chart

Nifty has maintained it uptrend after breaking out of the range. Oscillator like stochastics is showing that uptrend will continue for some more time. Nifty has the potential to test the trend line at 5300. Start booking profit from 5250 and Nifty may face selling pressure at 5300.
Chart of the day
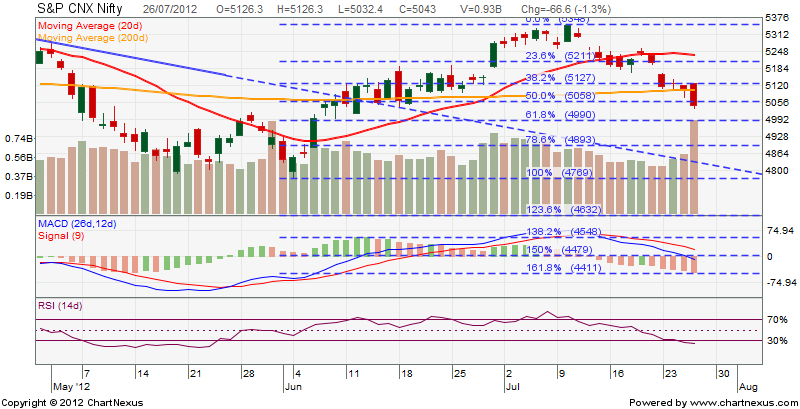
Nifty Monthly Chart

Today was the last trading day of this month so I thought of adding Nifty monthly chart. Nifty is trading within a triangle and this is clearly visible in monthly chart. The trading range of Nifty in the month of July was between 5079-5350. If we connect 5628-5350 we arrive at a trend line which is nothing but upper part of the triangle. My anticipation for the month of August is that Nifty may reach 5300 and in best case scenario it may move up to 5400 .After reaching these levels it may drift down towards 5000 once again.
Open Positions
| Scrip | Type | Qty | Price | CMP | P/L |
| Tata Steel | Long | 100 | 406 | 414.5 | 850 |
| Nifty 5300 CE | Long | 50 | 53 | 59 | 300 |
| SBI | Long | 25 | 2015 | 2005 | -250 |
Today's Trade
| Scrip | Qty | Buy Price | Sell Price | P/L |
| SBI | 25 | 2015 |
Nifty Medium Term Trend
| Trend | Down |
| Initiation Date | 26/07/2012 |
| Initiated at | 5043 |
| Low since change | 5043 |
| Reversal if closes above | 5283 |
Thought for the day
They always say time changes things , but you actually have to change them yourself.