Buy 4900 put option 2 lots @ cmp 90 sl blw 69(Intraday)
Friday, 11 May 2012
Wednesday, 24 August 2011
Nifty and Tata Motors
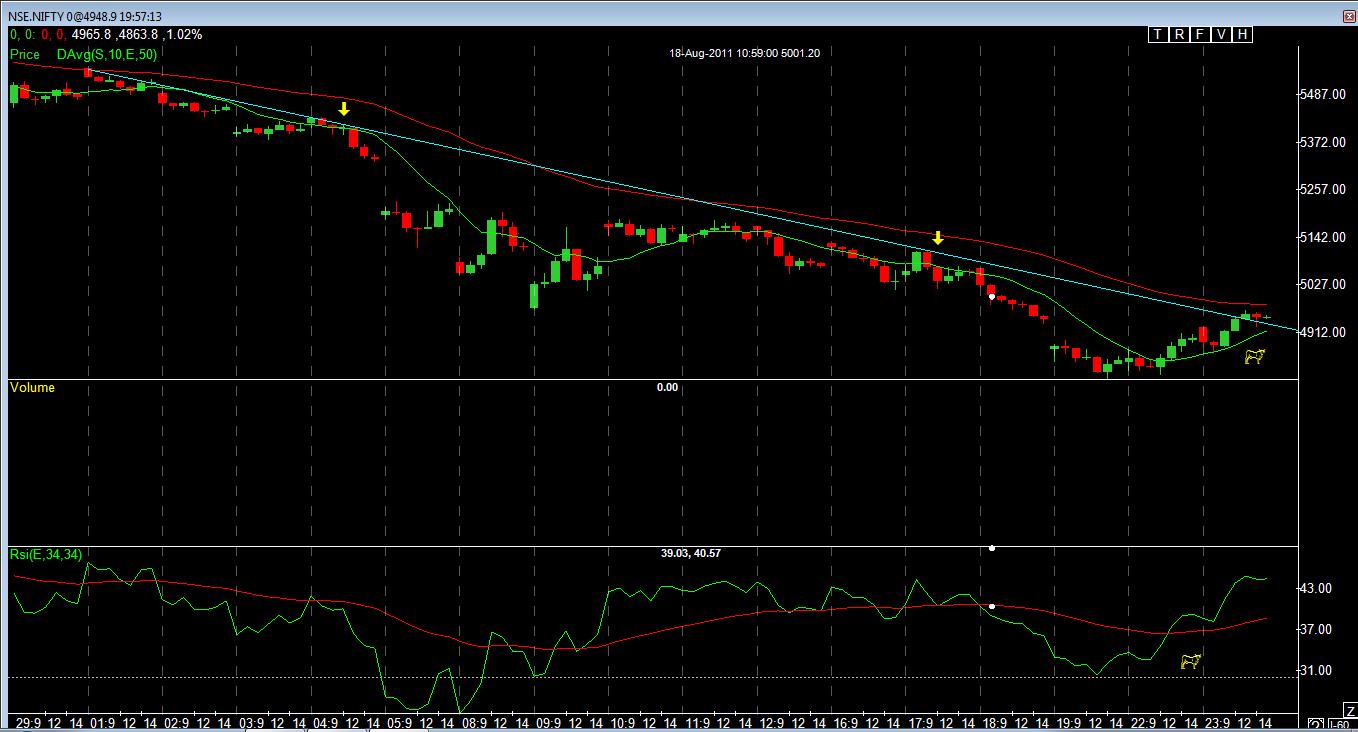
Nifty Hourly Chart

The Breakout which we have noticed in the previous session has failed and Nifty has slipped below 4940, now trading at 4888. One interesting observation in the chart is RSI, which was oversold when nifty was at 4800 , is indicating a new sell signal and it is at the level of 40. So some more downside can be expected.
Short term traders can sell nifty below 4875 for a target of 4800 in coming days. Keep a strict stop loss above 4910.
Tata Motors

Tuesday, 23 August 2011
Nifty and BHEL
Nifty Hourly Chart
Nifty is indicating a breakout from the trend line in hourly chart. Indicator like RSI has given buy signal. So today's closing of Nifty at 4948 has confirmed short term uptrend.
Nifty Daily Chart

Nifty has bounced back from 4800. Nifty has managed to close above 4940. Now the target will be 5000-5150 and 5200.
BHEL

BHEL is consolidating in a narrow range. Indicators like MACD and Stochastics are showing the signs of short term uptrend.Buy BHEL only if closes above 1791 target is up to 1900(level 1900 was acting as support earlier and now resistance.) in short term stop loss below 1750.
Monday, 22 August 2011
Nifty and M&M
Nifty Daily Chart

Nifty has managed to take support at 4800. Do not short untill market closes below 4800. Buy Nifty only above 4940 for a target of 5000-5100 keeping a stop loss of 4900.
M&M

After reaching a descending trend line M&M is consolidating in a narrow range of 30-40 points. Short M&M if it closes below Rs.700 target Rs.680-660 stop loss above 715.(short term call)
Sunday, 21 August 2011
Nifty and LT
Nifty Daily Chart

If nifty closes below 4800 it can go down up to 4600. Now 4940 can act as resistance and any long position in Nifty should be taken only above 5940 for a short term target of 5100-5150.
LT Weekly Chart

Parabolic SAR on weekly chart is showing sell signal. Other indicators like MACD and stochastics are indicating that trend could be down for medium term. Sell LT at CMP for a target of Rs.1500 stop loss 1575.(2-4 days)
(Above mentioned levels are spot levels. Targets are indicative, you can exit much earlier)
Disclaimer: Above mentioned calls are based on my understanding about technical analysis. Please do your own due diligence before taking them.
Subscribe to:
Posts (Atom)