Wednesday, 25 July 2012

Market update for 26/07/2012


Nifty hourly chart


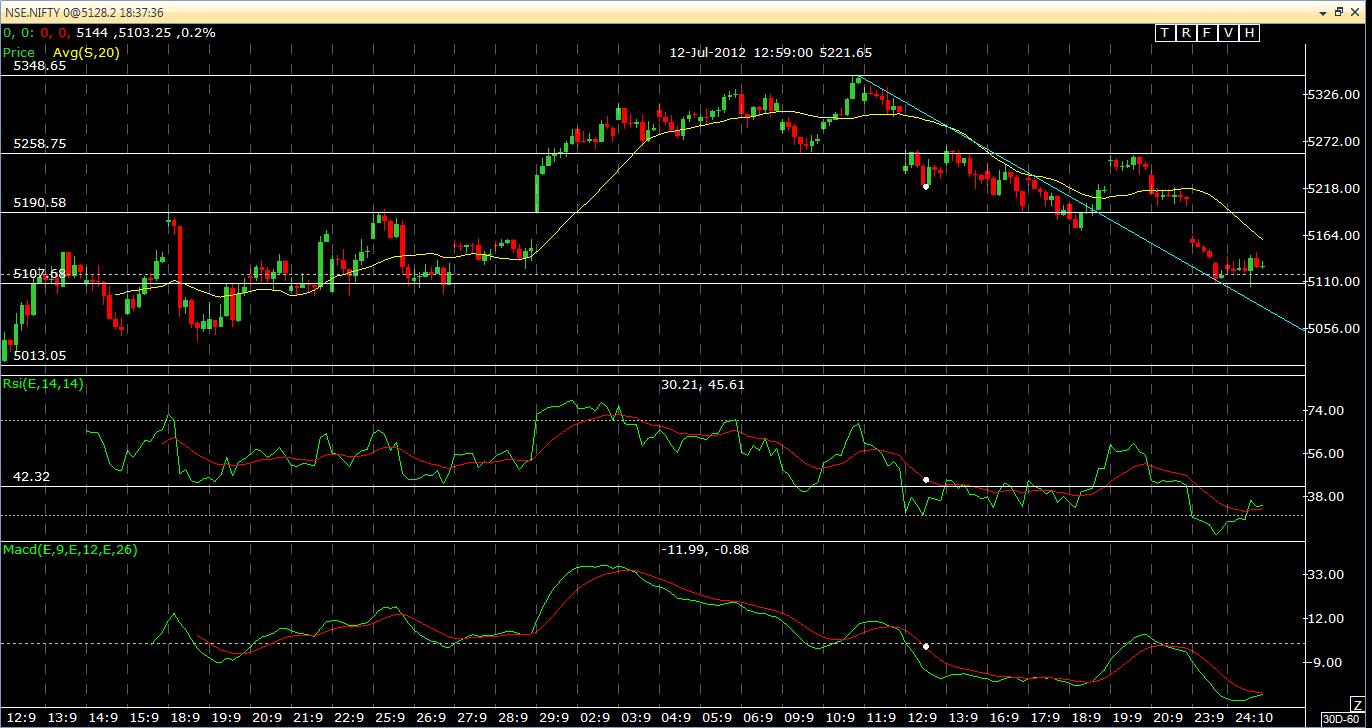
Nifty hourly chart indicated break down in the first few hours of trading session. Day low was at 5076 but Nifty managed to recover and closing is at 5109 down by 18 points.

As per hourly chart the important resistance levels are 5165-5191. Support levels are 5100-5080. Short term trend remains down so sell Nifty on rise.Reversal of the trend is above 5200.

Nifty daily chart


Nifty is still holding 200 DMA at 5100. If Nifty closes below 5080 then major reversal of the trend can be expected.


Chart of the day


Glaxo


From past two days Glaxo is one the gainers in spite of Nifty closing in red. Glaxo is not the darling of speculators. It is a thinly traded stock and from past few months it was consolidating at 1980-2050.
It has gained Rs.80 in past 2 trading sessions and has closed above important moving averages like 100 and 200 DMAs. It is expected to reach a target of Rs.2200 in short term.

Open Positions 


Scrip Type Qty  Price CMP P/L
Glaxo Long 20 2082 2150 1360
Nifty Aug fut short 50 5126 5141 -750
Nifty Aug 5200 CE Long 50 72 75 150


Today's Trade


Scrip Qty Buy Price Sell Price P/L
Nifty Aug fut 50 5126    
Nifty Aug 5200 CE 50 72    
Hero Mot 30 2022 2036 -420


Nifty Medium Term Trend


Trend  Up
Initiation Date 12/06/2012
Initiated at  5116
High since change 5345
Reversal if closes below 5090

Thought for the day 


Great mind discuss ideas , average mind discuss events , small mind discuss people.

Tuesday, 24 July 2012

Market update for 25/07/2012


Nifty hourly chart


                                                     Click on the chart to enlarge

In the previous post it was mentioned that Nifty has taken support at sloping trend line which is at 5107. Today's trading session was choppy and Nifty has bounce back from support levels.Unless Nifty breaks 5100 we cannot expect further fall. Now the trading range is 5100-5191.


Nifty daily chart


Nifty has managed to hold 200 DMA. If we consider the upward rally from 4769 to 5348 then 38.2% retracement is at 5127 and today Nifty has closed at 5128. So the decline in Nifty is temporarily halted at 38.2%. Nifty will get major support till 5100. Below 5100 the targets are 5058-4990.

Today's candle stick pattern is called 'doji'. Doji indicates the indecision in market - that means lack of clarity of direction.

The overall direction of the market will remain down. Initiate new short positions if Nifty closes below 5100.

Chart of the day


Copper


Copper was trading in a range and the range was 422-432. Yesterday this range is broken and copper had closed at 419.95. The medium term trend of copper will be down and it will face strong resistance around Rs.424. Positional traders can short copper and reversal will be closing above Rs.424.

Open Positions


Scrip Type Qty  Price CMP P/L
Glaxo Long 20 2082 2110 560


Today's Trade


Scrip Qty Buy Price Sell Price P/L
Bank Nifty Aug  25 10531 10347 4600
Bank Nifty Aug 10500 CE 25 225 211 -350
Minifty Aug fut 20 5216 5149 1340
Maruti 40 1197 1205 320

Nifty Medium term trend


Trend  Up
Initiation Date 12/06/2012
Initiated at  5116
High since change 5345
Reversal if closes below 5090


Thought for the day


Condemn none : if you can stretch out a helping hand , do so . If you cannot , fold your hands, bless your brothers and let them go in their own way. -Swami Vivekananda


Dear Traders ,

I am  providing short term trading recommendations ( holding period 1 day - 5 days) as well as medium term recommendations (up to 1 month) for equity and FnO traders . Recommendations will be sent through SMS. To know more details please write a mail to karthik4ta@yahoo.com

Monday, 23 July 2012

Market update for 24/07/2012


Nifty hourly chart


Nifty has showed a large movement after a long time of consolidation. Nifty has closed at 5117 down by 87 points. It has closed below 5190 and so the significance of this breakout is very high. Almost all sectors were weak today. Banks , Metals , Automobiles were the major losers.

What next?

The short term trend remains down. Reversal can happen only if Nifty closes above 5200. On the above chart you can see that Nifty has taken an intermediary support at a sloping trend line. This trend was acting as resistance and now it will be support. Further fall in Nifty can be expected only if Nifty sustains below 5100.

Nifty daily chart


Nifty has turned bearish before a week when the raising wedge was broken. This sharp fall is only the continuation of the trend. Now Nifty has taken support at 200 DMA which is at 5100. Once Nifty closes below this level the trend will remain down from short term to medium term perspective.

Bank Nifty  


The regular readers of this blog might recall that before few days that we had indicated a sell on Bank Nifty  if  it closes below 10500. On Friday we have initiated sell on Bank Nifty aug fut . We are expecting a target of 10100 and much below.

Open Positions


Scrip Type Qty  Price CMP P/L
Bank Nifty Aug  short 25 10531 10315 5400
Bank Nifty Aug 10500 CE long  25 225 211 -350
Minifty Aug fut short 20 5216 5145 1450


Today's Trade 


Scrip Qty Buy Price Sell Price P/L
JSW Steel 60 691 695 240
SBI 20 2097 2105 160


Nifty Medium Term trend


Trend  Up
Initiation Date 12/06/2012
Initiated at  5116
High since change 5345
Reversal if closes below 5080


Thought for the day


Wanting to reform the whole world without discovering ones true self is like trying to cover the world with leather to avoid the pain of walking on stones and thrones. It is much simpler to wear shoes. Sri Ramana Maharshi