Thursday, 3 January 2013


Performance of Trading calls in the month of December


Wednesday, 2 January 2013


Market updates for 03/01/2013


Nifty daily chart


 Nifty has gained nearly 100 points in two trading sessions. Now it has reached an important resistance at 6000.Once Nifty closes above 6000 next target will be 6100. RSI suggests that at 6000 level Nifty is not over bought so continue to hold long positions for a target of 6100-6150.
 

SBI Weekly Chart


In yesterday's trading session we had initiated long in SBI futures at Rs.2442 . Today we booked profit at Rs.2473 as SBI has reached an important resistance in weekly chart. Traders might have observed that after making a high of Rs.2480 SBI started falling. We will re enter after breakout.
 

Stocks which have turned bullish

 
BHEL , LT , CCL , Opto Circuits
 

Nifty Medium Term Trend

 
Trend  UP
Initiation Date 29-11-12
Initiated at  5825
High since change 6006
Reversal if closes below 5800


Thought for the day

 
India is not only a country and something geographical, but the home and the youth of the soul, the everywhere and nowhere, the oneness of all times.
~~~ Herman Hesse (German poet and novelist)


Tuesday, 1 January 2013


Market updates for 02/01/2013


SBI Daily Chart


SBI was one of the top performer in today's trading session as it was up by 1.7%. The significant development in daily chart of SBI is it has breached trend line resistance at Rs.2420. Further upside is expected.
 

LT Daily chart

 
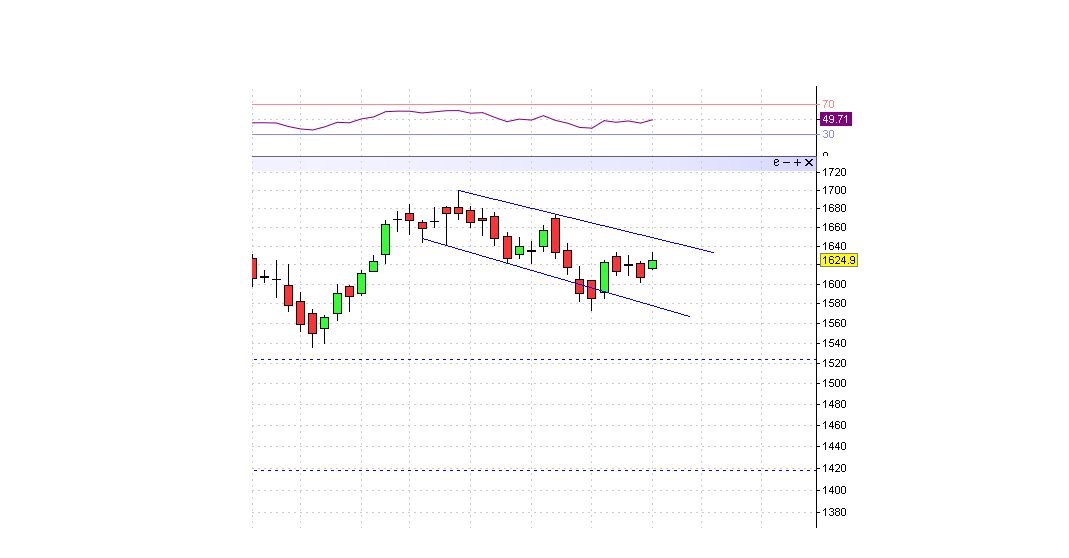
LT is trading within in a channel. Support is around Rs.1600-1580 and resistance is around Rs.1640. Breakout from Rs.1640 will take LT to much higher levels.
 

Nifty Monthly Chart

 
Nifty is moving in a ascending channel. A trend line in monthly chart  is drawn by joining 5177 and 5630 (marked in circles) and this trend line resistance at 6100 can act a major resistance in coming days. So one argument will be rally from 6100-6300 may not be an easy one. On the other hand we may also think that since lot of money is flowing into Indian market from FIIs this trend line might be breached. Lets see !!?
 

Nifty medium term trend

 
Trend  UP
Initiation Date 29-11-12
Initiated at  5825
High since change 5960
Reversal if closes below 5680
 

Thought for the day

Tell me, why is the media here so negative? Why are we in India so embarrassed to recognise our own strengths, our achievements? We are such a great nation. We have so many amazing success stories but we refuse to acknowledge them. Why?
~~~ Abdul Kalam


Sunday, 30 December 2012


Market updates for 31/12/2012


Nifty daily chart


Nifty is in a consolidation mode from past 1 month and breakout is expected to happen in one or two trading sessions.
 
Whole world is closely watching developments about ' Fiscal Cliff' and the impact will be known on Tuesday morning that is on 1/1/2013. So don't hold too many positions. Traders can consider initiating position based on direction of breakout.
 

Nifty weekly chart


From past one month Nifty has failed to break barrier at 5950. Breakout from this level on daily or weekly basis will take Nifty to 6150.
 

Copper daily chart


Copper is consolidating between 441-438. It has resistance at Rs.442 and if it sustains above this level then it can reach Rs.447.
 

M&M weekly chart


M&M has exactly closed at support in Weekly chart. A weekly close below Rs.925 will lead to further fall in stock price. Wait for breakout.
 

Nifty medium term trend

 
Trend  UP
Initiation Date 29-11-12
Initiated at  5825
High since change 5950
Reversal if closes below 5680


Thought for the day

 
It is true that even across the Himalayan barrier India has sent to us such unquestionable gifts as grammar and logic, philosophy and fables, hypnotism and chess, and above all our numerals and our decimal system. But these are not the essence of her spirit; they are trifles compared to what we may learn from her in the future.~ Will Durant (American philosopher)


Thursday, 27 December 2012


Market estimates for 28/12/2012


DJIA


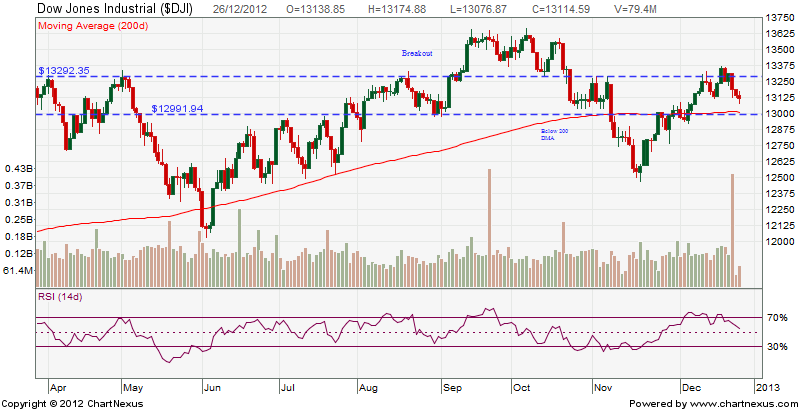
After testing resistance at 13300 Dow Jones in in down trend. It is likely to test 13000 in short term where 200 DMA is situated.
 

M&M


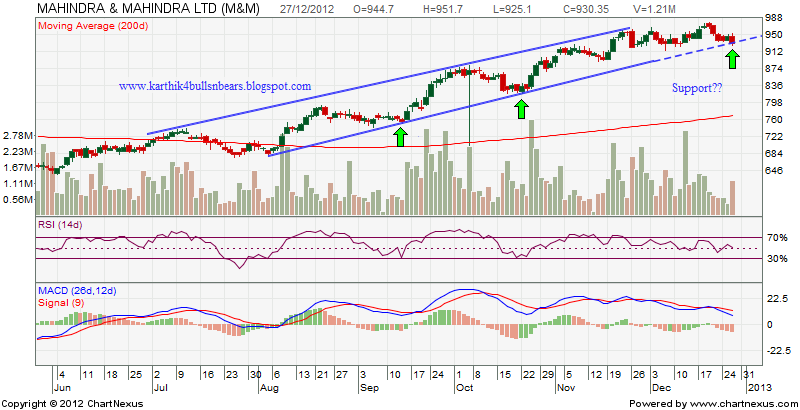
M&M is one of the top performers in this rally. It is moving in a ascending channel and today it has reached an important trend line support. Since overall direction of the market is bullish it is likely to bounce. However if it closes below the trend line resistance then it is likely to fall further.
 

Nifty medium term trend

 
Trend  UP
Initiation Date 29-11-12
Initiated at  5825
High since change 5950
Reversal if closes below 5680


Thought for the day

 
India conquered and dominated china culturally for 20 centuries without ever having to send a single solider across her boarder - Hu Shih (Chinese Ambassador to USA)