Nifty Weekly Chart

Nifty is trading below key support level and also below trend line. For very short term 5000 may act as a support and market may give a relief rally till 5150-5200. If market closes below 5000-4950 we may see levels of 4800 which is 50% retracement of the rally from the bottoms of 2008. Investors can start buying blue chip companies. Starting SIP in large cap funds is also advisable.
Nifty daily chart
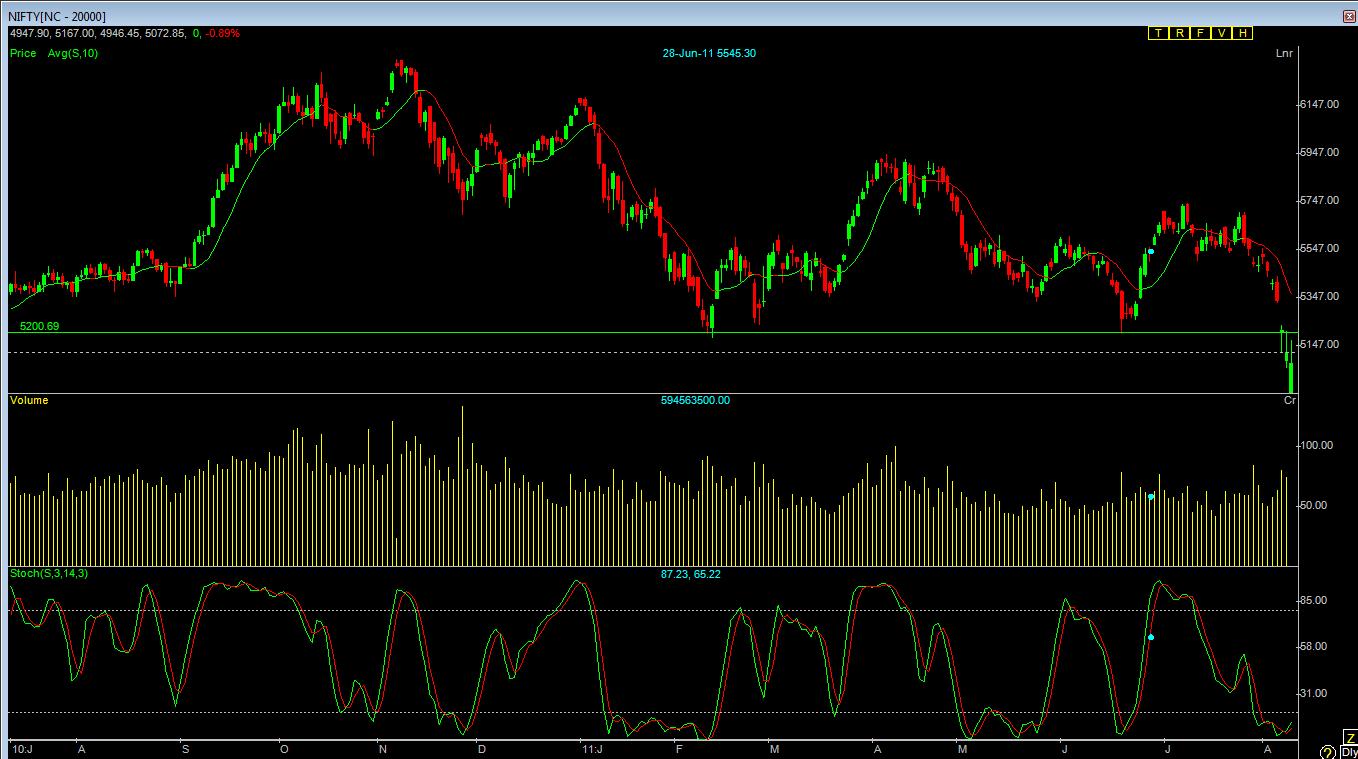
Stochastics in Nifty daily chart shows that nifty is oversold. However moving average is still negative. As per my observation any trend(up or down) will be followed by consolidation. So I am expecting Nifty to consolidate between 5000-5200 for few days before taking any direction.
Intraday Traders can Buy Nifty only above 5164 for a target of 5202
Sell Nifty below 4982 for a target of 4944
(Don't trade in first 15 mins)
Disclaimer: Above mentioned calls are based on my understanding about technical analysis. Please do your own due diligence before taking them.
No comments:
Post a Comment