Market update for 12/07/2012
Nifty hourly chart

(click on the chart to enlarge)
In today's trading session Nifty has lost a major part of yesterday's gain. Nifty shut shop at 5306 down by 39 points. Realty , Metals , Oil and gas , power were the laggards in today's session. The ex breakout which happened yesterday didn't act as a continuation pattern and we are ended up in consolidation region once again.
5260 is the strong support and any breakout from this level will take Nifty to 5200.
Nifty Daily chart

Even though the momentum is less and market is entering a narrow range there is no doubt that the trend is up. Nifty is taking support at lower part of the wedge and trying to reach higher levels. The trading range is getting narrower. I will not be surprised if Nifty bounces back tomorrow. Until Nifty is inside the wedge the trend will remain up. Supports for Nifty are available at 5290-5260 and 5200. Resistance is at 5350-5400.
Chart of the day
LT Weekly chart

Let me clarify that at this point of time LT is neither a buy nor a sell. Positional traders need to wait for two more days before taking any position in LT. The regular readers of this blog might have observed that before 2 weeks we had recommended to buy LT at Rs.1375 for a target of Rs.1440 and today target is achieved.
LT can go up further if it closes above Rs.1420 on weekly basis. So wait for two more days on Monday if it is above Rs.1420 then again buy LT for a target of Rs.1480-1500 and stop loss will be closing below Rs.1370. Time frame at least 15 days.
Infosys straddle
Straddle is one of the commonly used option trading strategy. This strategy is used when a trader is expecting a significant move in the index/stock but unsure about the direction.
Tomorrow Infosys is declaring its Q1 result and I have been observing that on the day of result Infy will be +/- 5% from previous close and some times 10% which depends on the news flow. So today we have suggested our subscribers to buy 2500 call option at Rs. 94 and 2500 put option at Rs.104.50. The pay off from this strategy can be observed in the below mentioned chart.
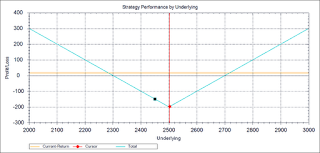
| Total Investment | 198.3 |
| Total Debit | 198.3 |
| Profit Potential | Unlimited |
| Max Loss | 198.3 |
| Lower BEP | 2301 |
| Higher BEP | 2698 |
Open Positions
| Scrip | Type | Qty | Price | CMP | P/L |
| Sesa Goa | Long | 100 | 206 | 200 | -600 |
| Infy 2500 CE | Long | 125 | 94 | 84 | -1250 |
| Infy 2500 PE | Long | 125 | 104.5 | 133 | 3562.5 |
Today's Trade
| Scrip | Qty | Buy Price | Sell Price | P/L |
| SBIN | 50 | 2243 | 2223 | -1000 |
| Nifty 5200 PE | 50 | 51 | 21 | -1500 |
| Bank Nifty fut | 25 | 10600 | 10750 | 3750 |
| Bank Nifty 10600 PE | 25 | 229 | 129 | -2500 |
| M&M | 50 | 725 | 735 | 500 |
| Tata Steel | 65 | 443 | 437.5 | -357 |
Nifty Medium Term Trend
| Trend | Up |
| Initiation Date | 12/06/2012 |
| Initiated at | 5116 |
| High since change | 5345 |
| Reversal if closes below | 5120 |
Thought for the day
Don’t
ever average losses. Decrease your trading volume when you are doing poorly;
increase your volume when you are trading well. Never trade in situations where
you don’t have control.
No comments:
Post a Comment