Market updates for 05/09/2012
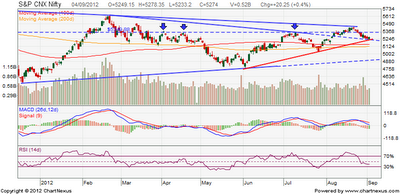
Nifty has once again tested 5250 by making intraday low of 5234. Traders should note that supports and resistance are temporary in nature. If the prices of and underlying asset is reaching the support/resistance again and again then they will fall apart.
Nifty has made an intraday bounce back and closed at 5276 up by 23 points. At 5276 it is facing a trend line resistance in hourly chart. Short term trend of the market is down and reversal will be above 5350.
Nifty daily chart
Nifty is consolidating in a narrow region by keeping 5250 as support and at the same time it is facing selling pressure around 5300. The expected short term target is 5250-5220.
Open positions
| Scrip | Type | Price | CMP | P/L |
| Britannia | Long | 486 | 504.4 | 18.4 |
| V guard | Long | 410 | 407 | -3 |
| Nifty fut | Short | 5291 | 5301 | -10 |
| Nifty 5300 CE | Long | 77.5 | 81.5 | 3.5 |
Positions squared off
| Scrip | Buy Price | Sell Price | P/L |
| IDFC fut | 130 | 133 | 3 |
| IDFC 130 CE | 6.65 | 4.6 | -2.05 |
| Infy 2300 PE | 27.5 | 24 | -3.5 |
Nifty medium term trend
| Trend | UP |
| Initiation Date | 07/08/20122 |
| Initiated at | 5336 |
| High since change | 5448 |
| Reversal if closes below | 5180 |


No comments:
Post a Comment