Market updates for 04/10/2012
Nifty daily chart

Nifty has managed to close above 5720 which is was an important resistance level. On 21/09/2012 Nifty made a large rally and made a high of 5720. After consolidating for 6 trading sessions it has come out of the range and closed at 5731 up by 12 points. Now the targets are 5740-5820.
Nifty weekly chart

Nifty has a hurdle at 5740 in weekly chart. Considering the present liquidity and momentum I am sure that this hurdle will be breached in coming days and this will take Nifty to 5820.
Chart of the day
Lead
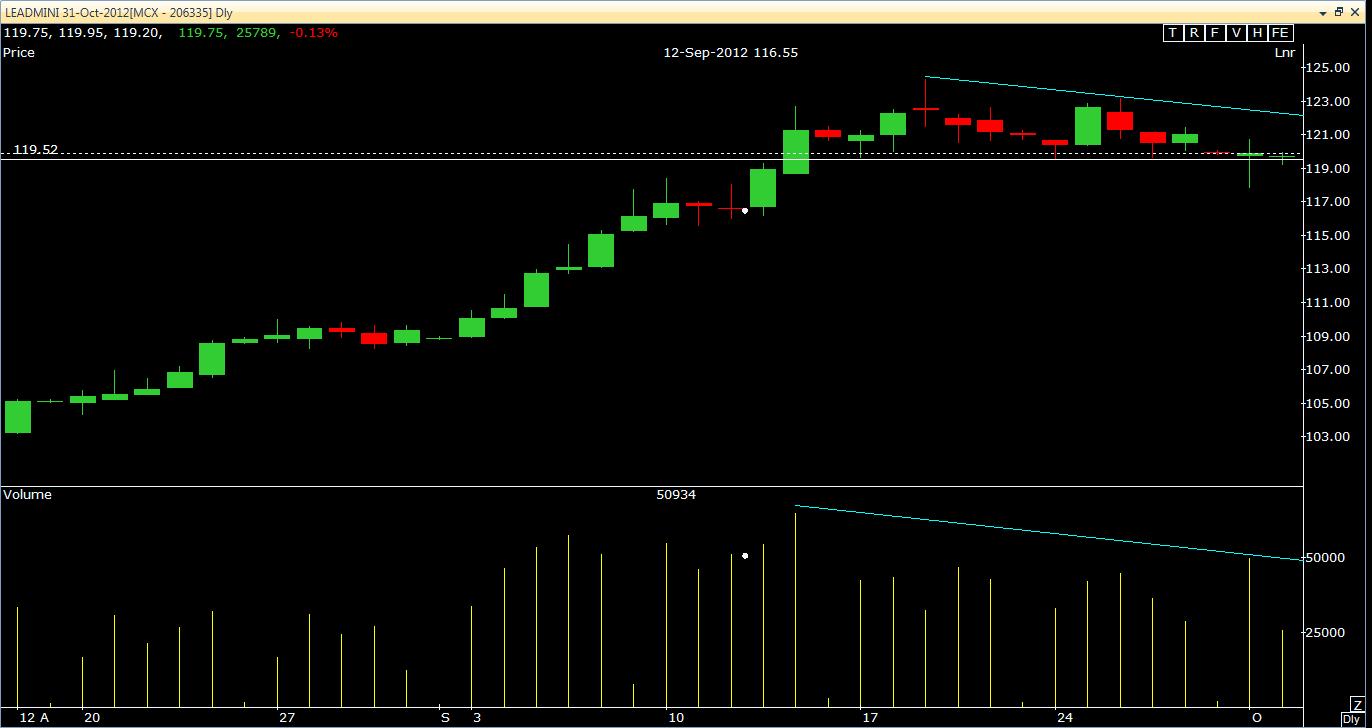
Lead has taken support at Rs.119.50. It has formed a triangle formation and the trading range is getting narrow. The possibility of downside breakout is high.
Nifty medium term trend
| Trend | UP |
| Initiation Date | 07/08/2012 |
| Initiated at | 5336 |
| High since change | 5737 |
| Reversal if closes below | 5485 |
Open positions
| Scrip | Type | Price | CMP | P/L |
| Tata Motors Fut | Long | 275 | 274.6 | -0.4 |
| Tata Motors 270 PE | Long | 9.3 | 8.65 | -0.65 |
| BHEL | Long | 249.5 | 249.9 | 0.4 |
| Ambuja Cement | Long | 205 | 215 | 10 |
| Coal India | Long | 364 | 365.2 | 1.2 |
Thought for the day
Success is turning knowledge into positive action. Thinking is easy , acting is difficult and to put ones thought into action is the most difficult thing in the world.
No comments:
Post a Comment