Market updates for 26/11/2012
Nifty daily chart
Nifty is consolidating between 5570-5630. I was expecting Nifty to reach 5500 in this expiry but so far there is no signs of breakout. Nifty has tested the trend line thrice , so the importance of this trend line is very high. Whenever a trend line / support / resistance is tested many number of times it becomes vulnerable. Lets wait for break out.
Nifty Weekly chart
Nifty has continued to form higher top and higher bottom. 5570 is acting as the base and 5740 is the resistance. It is already repeated many times that Nifty should close above 5740 on weekly basis to reach 5900.
Chart of the day
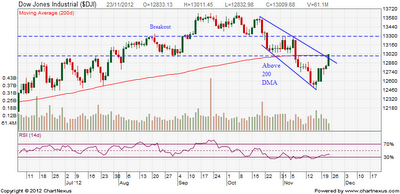
Dow Jones Industrial Average
Dow Jones was in down trend after elections. Now it has closed above 200 DMA and also above 12990 which was a critical resistance. Now it is likely to move towards 13300. Will Indian market participate in the rally?? Lets see.
Nifty medium term trend
| Trend | DOWN |
| Initiation Date | 16-11-12 |
| Initiated at | 5574 |
| Low since change | 5549 |
| Reversal if closes below | 5800 |
Thought for the day
Better is bread with a happy heart than wealth with vexation - Amenemop


No comments:
Post a Comment