Market updates for 18/01/2013
Hindalco Weekly chart
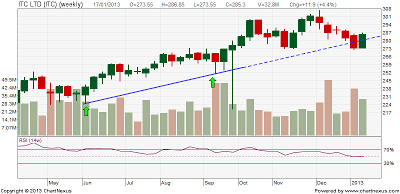
ITC Weekly chart
Weekly charts of Hindalco and ITC are the examples of breakouts which are not sustained. Hindalco closed above Rs.126.50 but it couldn't sustain for long time . Now it has once again fallen into consolidation zone.
ITC made a breakout from trend line support which was formed over a period of 6 months. Now it has once again trading above the trend line.
Traders should note that since we have one more trading session in this week closing above/below the trend line is necessary to estimate price targets.
Corporate results on 18/01/2013
ITC , HDFC Bank , M&M Finance , Mind Tree , NIIT
Nifty medium term trend
| Trend | UP |
| Initiation Date | 29-11-12 |
| Initiated at | 5825 |
| High since change | 6068 |
| Reversal if closes below | 5800 |
Thought for the day
You will never do anything in this world without courage . It is the greatest quality of mind next to honor. Aristotle


No comments:
Post a Comment