Thursday, 4 October 2012


Market estimates for 05/10/2012


Nifty hourly chart


As expected Nifty has breached resistance at 5740 and closed at 5787 up by 56 points. Nifty made a high of 5807 near to the expected target 5820.
 

Nifty daily chart


The uptrend in Nifty has remained intact and now the short term targets are 5820. Once Nifty sustains above 5820 the expected target is 5950.
 
I have seen many discipline medium term traders who have bought blue chip companies when market  was at 4800 levels.I had recommended LT at 1100 , Yes Bank at 270 , ICICI Bank at 850 and ITC at 190 to name a few.  These traders can start booking partial profit above 5950. Assuming that Nifty is going to reach 6300 in coming days , medium term traders should liquidate at least 50 %  position at  6000-6300 levels , invest in bonds and pray for dip!!
 

Chart of the day


BHEL


Above mentioned is the weekly chart of BHEL. This was recommended to subscribers who trade in cash segment as weekly chart is used for entry point.
 
BHEL has made a breakout from the trend line resistance  at Rs.238. The importance of this trend line is very high as it is formed for a period of around 2 years. The bad days of BHEL seems to be over at least for medium term and expected targets are Rs. 277-300.
 

Nifty medium term trend

 
Trend  UP
Initiation Date 07/08/2012
Initiated at  5336
High since change 5807
Reversal if closes below 5580


Position squared off

 
Scrip Buy Price Sell Price P/L
Tata Motors Fut 275 280 5
Tata Motors 270 PE 9.3 6.9 -2.4
Ambuja Cement 205 219.5 14.5


Open Positions

 
Scrip Type  Price CMP P/L
Axis Bank Fut Long 1155 1151 -4
Axis Bank 1150 PE Long 44 45 1
BHEL Long 249.5 266.5 17
Coal India Long 364 361.7 -2.3
 
 
My humble advice to my subscribers and non subscribers is that persistence is one of the most important quality of a successful trader. Expansion is followed by contraction and contraction is followed by expansion. During the time of contraction it is difficult to judge the direction (at least for me) so minor losses may happen. We cannot decide the value of an individual/trading system based on few failures. At the same time we should not persist until we lose everything in market. Some times persistence is god for kings an spiders but not for trader. Trader should know when to quit. 


Wednesday, 3 October 2012


Market updates for 04/10/2012


Nifty daily chart


Nifty has managed to close above 5720 which is was an important resistance level. On 21/09/2012 Nifty made a large rally and made a high of 5720. After consolidating for 6 trading sessions it has come out of the range and closed at 5731 up by 12 points. Now the targets are 5740-5820.


Nifty weekly chart


Nifty has a hurdle at 5740 in weekly chart. Considering the present liquidity and momentum I am sure that this hurdle will be breached in coming days and this will take Nifty to 5820.
 

Chart of the day


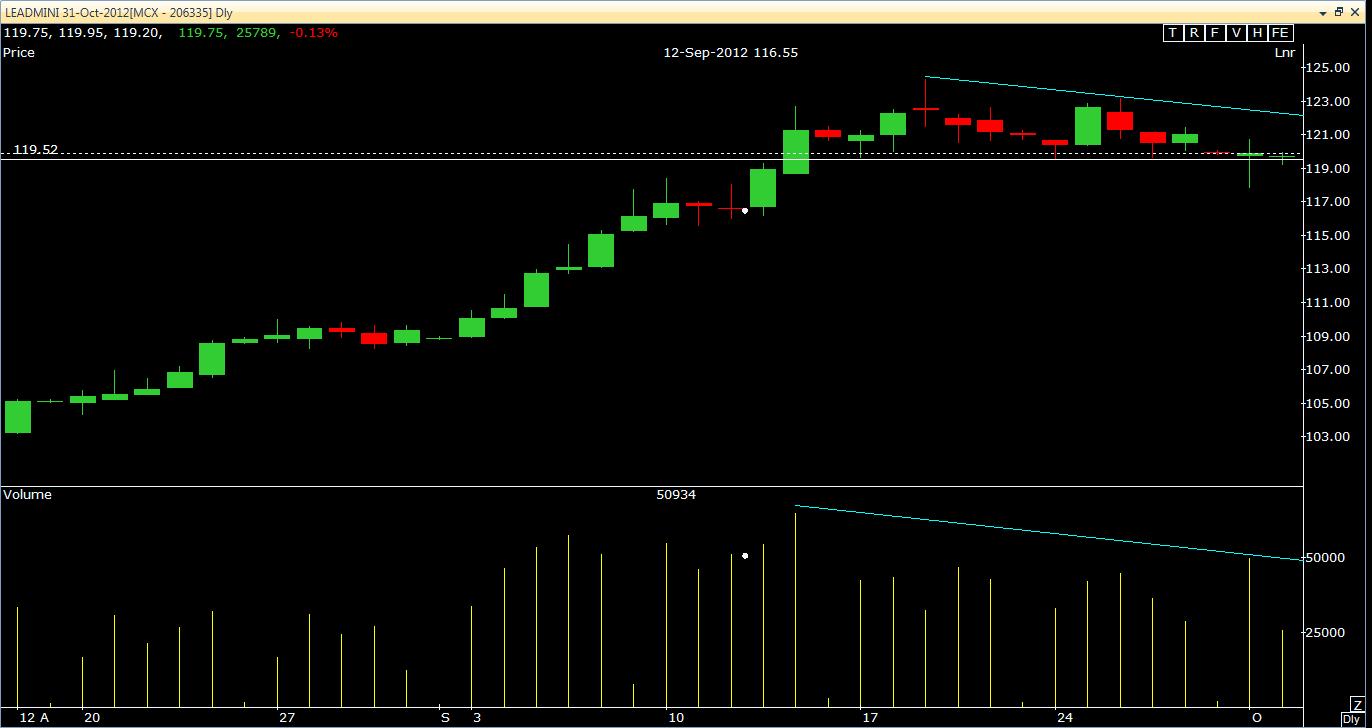
Lead


Lead has taken support at Rs.119.50. It has formed a triangle formation and the trading range is getting narrow. The possibility of downside breakout is high.


Nifty medium term trend

 
Trend  UP
Initiation Date 07/08/2012
Initiated at  5336
High since change 5737
Reversal if closes below 5485


Open positions

 
Scrip Type  Price CMP P/L
Tata Motors Fut Long 275 274.6 -0.4
Tata Motors 270 PE Long 9.3 8.65 -0.65
BHEL Long 249.5 249.9 0.4
Ambuja Cement Long 205 215 10
Coal India Long 364 365.2 1.2


Thought for the day

 
Success is turning knowledge into positive action. Thinking is easy , acting is difficult and to put ones thought into action is the most difficult thing in the world.


Tuesday, 2 October 2012


Market updates for 03/10/2012


Nifty daily chart


Consolidation in Nifty has continued for 6 trading sessions. Nifty has sustained above 5700 but unable to break resistance at 5720 on closing basis. Long position can be taken if Nifty closes above 5720. Target will be 5800.
 

Chart of the day


CNX IT


Infy


Both CNX IT and Infy had indicated bearish structures in daily chart. CNX IT had broken the lower part of the channel and sustained for two trading session. Infy had sustained below 200 dma at 2550 for two consecutive sessions and was expected to test lower part of the channel. But on Monday Infy took a u turn which triggered the stop loss.
 

Nifty medium term trend

 
Trend  UP
Initiation Date 07/08/2012
Initiated at  5336
High since change 5737
Reversal if closes below 5485


Open Positions

 
Scrip Type  Price CMP P/L
Tata Motors Fut Long 275 275.5 0.5
Tata Motors 270 PE Long 9.3 8.9 -0.4
BHEL Long 249.5 251.5 2
Ambuja Cement Long 205 209.5 4.5


Positions Squared off

 
Scrip Buy Price Sell Price P/L
Infy Oct Fut 2542 2494 -48
Infy Oct 2550 CE 104 128 24
Rel Ind Fut 850 840 -10
Rel Ind 840PE 21 25 4


Thought for the day

 
It is better to be violent if there is violence in our heart , than to put a cloak of nonviolence to cover impotence - Mahatma Gandhi 


Saturday, 29 September 2012


Market updates for 1/10/2012


Nifty daily chart


Nifty has once again bounced back and tested the previous high at 5720. However closing was below 5720 which means that Nifty is still trading within a range. So wait for the sustainable breakout before taking positions.

Nifty weekly chart


In weekly chart Nifty has sustained above 5630 for two consecutive weeks and hence the possibility of reaching 5830 is high. Nifty may consolidate within 5720-5630 for some more time. But this range is expected to break shortly as October is the month of quarterly result announcement and the breakout is going to happen on upside.


Nifty monthly chart


 Above is the monthly chart of Nifty. This chart is not useful from the point of view of short term trading. But it can be used to understand the long term (1-2 year) direction of market. In this chart technical indicator called MACD is used. MACD had indicated 'sell' in February 2011 and the downtrend lasted for more than one and half years. Now it has indicated 'buy' . That means the possibility of reaching at least 6200 in coming months is very high. This choppiness is going to continue but the trend will remain up.
 
So retail traders can start buying blue chip companies and quality mid cap companies at least now. Some day Nifty will reach 6200 (I don't know when) and at those levels if we cry that we didn't participate in rally then it is of no use.
 
Some people say that this rally is happening because of liquidity but not because of fundamentals. Yes GDP , IIP and others has reduced,inflation has increased but do you really think that the foreign institutions/ domestic institutions will invest in an economy by looking at GDP , IIP of one year ? under performance of single sector ? earnings of single quarter ? or chart pattern of Nifty based on 15 min time frame ??
 

Chart of the day


Infosys Ltd


Infosys has closed below 200 DMA for 2nd consecutive trading session. MACD has indicated sell and it is likely to test the lower part of the channel.


Nifty medium term trend

 
Trend  UP
Initiation Date 07/08/2012
Initiated at  5336
High since change 5720
Reversal if closes below 5485


Open Positions

 
Scrip Type  Price CMP P/L
Infy Oct Fut Short 2542 2425 17
Infy Oct 2550 CE Long 104 90 -14
Rel Ind Fut Long 850 841.5 -9.5
Rel Ind 840PE Long 21 26 5


Positions squared off

 
Scrip Buy Price Sell Price P/L
Rel Cap 432 442 10


Thought for the day

 
Obstacles are the frightful things you see when you take your eyes off the goal - Henry Ford


Thursday, 27 September 2012


Market updates for 28/09/2012


Nifty daily chart


Nifty has continued consolidating between  a narrow range. Since Nifty is in overbought territory it is likely to fall down to 5630-5600 levels before resuming another cycle of uptrend.
 

Chart of the day


CNX IT


CNX IT has broken down the channel. MACD is indicating downtrend. In today's trading session except HCL Tech most of the other stocks were under pressure. Avoid long position in IT stocks.
 

Nifty medium term trend

 
Trend  UP
Initiation Date 07/08/2012
Initiated at  5336
High since change 5720
Reversal if closes below 5485
 

Open Positions

 
Scrip Type  Price CMP P/L
Rel Cap Long 432 432.3 0.25


Positions squared off

 
Scrip Buy Price Sell Price P/L
Tata Motors Oct Fut 261.5 266.9 5.4
Tata Motors Oct 270 CE 9.7 7.4 -2.3
 

Thought for the day

 
The lure of the distant is deceptive. The great opportunity is where you are.