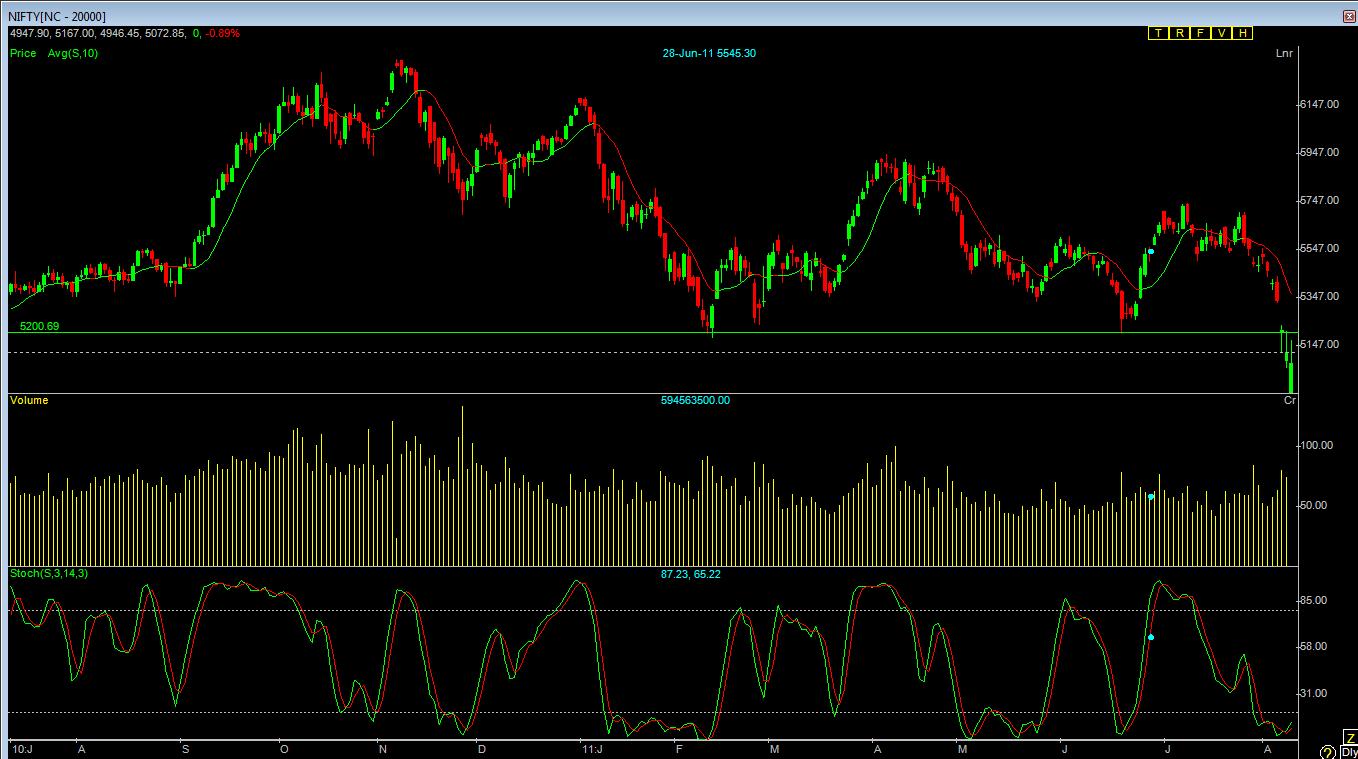
Wednesday, 10 August 2011

Nifty and BPCL

Nifty Daily Chart

Today Nifty made a high of 5198 and failed to cross 5200 which can act as immediate resistance. Apparently the expected relief rally seems to be completed today.
Market is expected to be range bound at least for few days and so the Nifty may test 5000 levels once again.Short term traders should avoid taking long position until nifty closes above 5200-5250 and use every uptrend to create short position.

Intraday Levels : Buy only above 5212 target 5236-5260
                          Sell only  below 5107 target 5086-5029
(Above mentioned levels are spot levels. Buy/sell after 10-15 mins of market opening)

BPCL

So far BPCL was extreamly bullish. But now indicators like RSI and Stochastics are showing early signs of weakness. In the chart you can see an ascending trend line which can act as immediate support and the next support is at Rs.650. Sell BPCL around Rs.685-690for a target of Rs.670-665-650 stop loss closing above Rs.710 (1 week)

Tuesday, 9 August 2011

Nifty Technical View

Nifty Weekly Chart

Nifty is trading below key support level and also below trend line. For very short term 5000 may act as a support and market may give a relief rally till 5150-5200. If market closes below 5000-4950 we may see levels of 4800 which is 50% retracement of the rally from the bottoms of 2008. Investors can start buying blue chip companies. Starting SIP in large cap funds is also advisable.

Nifty daily chart


Stochastics in Nifty daily chart shows that nifty is oversold. However moving average is still negative. As per my observation any trend(up or down) will be followed by consolidation. So I am expecting Nifty to consolidate between 5000-5200 for few days before taking any direction.

Intraday Traders can Buy Nifty only above 5164 for a target of 5202
Sell Nifty below 4982 for a target of 4944
(Don't trade in first 15 mins)

Disclaimer: Above mentioned calls are based on my understanding about technical analysis. Please do your own due diligence before taking them.

Monday, 8 August 2011

Nifty and Bharti

NIFTY WEEKLY CHART


Yesterday Nifty has closed below 5200 level which indicates that bulls are dominated by bears. Nifty closed at 5118 and now the earlier support 5200 will act as strong resistance.
One more interesting observation is 50 DMA has turned red and it is dropping. In the above pic you can see that it gave a buy indication around 4000 and now it is showing sell indication. Now the question is ' Is this the beginning of a downtrend?' .
It would be too early to comment , but I can only say use every upside rally to exit long and initiate short positions.

Bharti


Currently Bharti is in short term downtrend but it has taken support at the above shown trend line. Wait for closing below trend line that is below Rs.396 and take short position for a target of Rs.380-370 stop loss closing above Rs.396.
 
Disclaimer: Above mentioned calls are based on my understanding about technical analysis. Please do your own due diligence before taking them.

Friday, 5 August 2011

Nifty,LIC,Bharti

Nifty Weekly Chart

As expected nifty has reached 5200 today.Even though Nifty made a low of  5117 bulls are able to defend the previous bottom 5200 and our dear fundametalists are busy in talking about INDIA GROWTH STORY
Now the question is WHAT NEXT?
Nifty is above 5200 that doesn't mean that market has reached the bottom. You can see in the chart that stochatics is indicating a downward trend so there could be some more fall?!.
I am not asking you to take short position in nifty but wait for some time before taking any positions in Nifty.

LIC HOUSING FINANCE

Weekly Chart


A technical tool which is called as parabolic stop and reversal shows that so far LIC Hsg Fin was in uptrend. However in this week the uptrend seems to be over atleast for short term. MACD has shown sell signal. So sell LIC Hsg Fin below Rs.200 for a target of Rs.190-Rs.185 . Stoploss will be updated in the later stages.

Bharti

Bharti Daily Chart


So far Bharti was in perfect uptrend. Parabolic SAR and MACD on daily chart shows downtrend. Sell Bharti at CMP for a target of Rs.405-390-390 stoploss will be updated.

Disclaimer: Above mentioned calls are based on my understanding about technical analysis. Please do your own due diligence before taking them.

Thursday, 4 August 2011

Nifty and Axis Bank

Nifty Weekly Chart


Nifty has shown a break down. Tomorrow is the last trading session of this week. If nifty closes in   red  then the possibility of reaching 5200 will be very high. At this point of time Dow Jones is down 2.4% and Nasdaq 3% !!. Europe market is also down by 2-3% which indicates gap down open tomorrow.

Axis Bank


So far Axis Bank was not bearish unlike other Banking Companies. However Chart shows beginning of downtrend in Axis Bank. Sell signal by RSI, Stochastics, closing below 20 DMA are the indicators which shows that Axis Bank can come down to Rs.1250-1225 in near future. As per Parabolic SAR  if Axis Bank touches Rs.1277 then that gives further confirmation of down trend.

Sell Axis Bank for a target of Rs 1250-1225 stop loss above Rs.1320

FnO Traders can Sell:

Bharti only at Rs.410 target Rs.400-390

Today Bajaj Auto sell call is activated continue holding short position.

(Above mentioned levels are spot levels. Targets are indicative, you can exit much earlier. Stop loss will be communicated in later stages)

Always remember ' Your intuition has got limitation so use technical analysis to earn money in market'