Wednesday, 11 July 2012

Market update for 12/07/2012


Nifty hourly chart


                                                      (click on the chart to enlarge)

In today's trading session Nifty has lost a major part of yesterday's gain. Nifty shut shop at 5306 down by 39 points. Realty , Metals , Oil and gas ,  power were the laggards in today's session. The ex breakout which happened  yesterday didn't act as a continuation pattern and we are ended up in consolidation region once again.

5260 is the strong support and any breakout from this level will take Nifty to 5200.

Nifty Daily chart


Even though the momentum is less and market is entering a narrow range there is no doubt that the trend is up. Nifty is taking support at lower part of the wedge and trying to reach higher levels. The trading range is getting narrower. I will not be surprised if Nifty bounces back tomorrow. Until Nifty is inside the wedge the trend will remain up. Supports for Nifty are available at 5290-5260 and 5200. Resistance is at 5350-5400.

Chart of the day


LT Weekly chart


Let me clarify  that at this point of time  LT is neither a buy nor a sell. Positional traders need to wait for two more days before taking any position in LT. The regular readers of this blog might have observed that  before 2 weeks we had recommended to buy LT at Rs.1375 for a target of Rs.1440 and today target is achieved.

LT can go up further if it closes above Rs.1420 on weekly basis. So wait for two more days on Monday if it is above Rs.1420 then again buy LT for a target of Rs.1480-1500 and stop loss will be closing below Rs.1370. Time frame at least 15 days. 

Infosys straddle


Straddle is one of the commonly used option trading strategy. This strategy is used when a trader is expecting a significant move in the index/stock but unsure about the direction.

Tomorrow Infosys is declaring its Q1 result and I have been observing that on the day of result Infy will be +/- 5% from previous close and some times 10% which depends on the news flow. So today we have suggested our subscribers to buy 2500 call option at Rs. 94 and 2500 put option at Rs.104.50. The pay off from this strategy can be observed in the below mentioned chart.
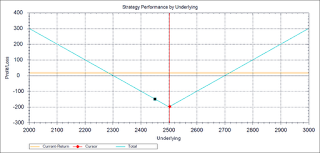


Total Investment 198.3
Total Debit 198.3
Profit Potential Unlimited
Max Loss 198.3
Lower BEP 2301
Higher BEP 2698


Open Positions


Scrip Type Qty  Price CMP P/L
Sesa Goa Long 100 206 200 -600
Infy 2500 CE Long 125 94 84 -1250
Infy 2500 PE Long  125 104.5 133 3562.5


Today's Trade


Scrip Qty Buy Price Sell Price P/L
SBIN 50 2243 2223 -1000
Nifty 5200 PE 50 51 21 -1500
Bank Nifty fut 25 10600 10750 3750
Bank Nifty 10600 PE 25 229 129 -2500
M&M 50 725 735 500
Tata Steel 65 443 437.5 -357


Nifty Medium Term Trend


Trend  Up
Initiation Date 12/06/2012
Initiated at  5116
High since change 5345
Reversal if closes below 5120


Thought for the day


Don’t ever average losses. Decrease your trading volume when you are doing poorly; increase your volume when you are trading well. Never trade in situations where you don’t have control.


There was a man taking a morning walk at the beach. He saw that along with the morning tide came hundreds of starfish and when the tide receded, they were left behind and with the morning sun rays, they would die. The tide was fresh and the starfish were alive. The man took a few steps, picked one and threw it into the water. He did that repeatedly. Right behind him there was another person who couldn't understand what this man was doing. He caught up with him and asked, "What are you doing? There are hundreds of starfish. How many can you help? What difference does it make?" This man did not reply, took two more steps, picked up another one, threw it into the water, and said, "It makes a difference to this one."


What difference are we making? Big or small, it does not matter. If everyone made a small difference, we'd end up with a big difference, wouldn't we?

Tuesday, 10 July 2012

Market update for 11/07/2012


Nifty hourly chart


Nifty has come out of the trading range which was between 5262-5318. Now the short term targets are 5375-5400 reversal of the trend will be below 5060. Around 5400 level short term traders can exit major part of their long positions. This trend is expected to continue tomorrow as well. If Nifty comes down to 5330-5318 it will be an opportunity to take long positions and stop loss should be below 5260.

Nifty daily chart


From past few trading session Nifty was again and again testing 5300. For the third time it has closed above 5300. Now it can test 5400 levels.

Chart of the day


Copper


Copper has been forming lower high lower low formation from few months. On 6th July copper has breached Rs.424.65 . Targets for Copper are Rs.416-412 and below reversal above Rs.432.


Open Positions


Scrip Type Qty  Price CMP P/L
Sesa Goa Long 100 206 200 -600
Nifty 5200 PE Long 50 51 21 -1500
Bank Nifty fut Long  25 10600 10758 3950
Bank Nifty 10600 PE Long 25 229 131 -2450
M&M Long 50 725 733.5 425


Today's Trades


Scrip Qty Buy Price Sell Price P/L
SBIN 50 2221 2229 400
Maruti 100 1205 1220 1500

Nifty Medium term trend


Trend  Up
Initiation Date 12/06/2012
Initiated at  5116
High since change 5345
Reversal if closes below 5120


Thought for the day


" Rather fail with honor than suceed by fraud"  - Sophocles


Monday, 9 July 2012

Market Update for 10/07/2012


Nifty hourly chart


Nifty is still in a consolidation phase and trading between 5260-5318. Unless a breakout happens it will not be a wise decision to initiate a trade in Nifty. If Nifty breaks 5318 then the expected target will be 5375 and below 5260 target will be 5200.


Nifty daily chart


Nifty has formed a raising wedge in daily chart. In today's trade it has closed at the lower part of the range that is at 5275 which increases the importance of tomorrow's trading session. Closing below 5260 can be considered as a short pull back from the recent rally. On the other hand if it closes above 5275 then the consolidation will continue.

Chart of the day


Ambuja Cement


In today's trading session Ambuja Cements has closed at an important support level which is at Rs.167. Other indication which indicates that this scrip is in a verge of downside break out are closing below 20 DMA which is at Rs.170.50 , MACD is indicating sell. If Ambuja cements closes below Rs.166 then initiate short position for a target of Rs. 157 and below . Stop loss will be closing above Rs.172.

Open Positions


Scrip Type Qty  Price CMP P/L
Sesa Goa Long 100 206 196 -1000
Nifty 5200 PE Long 50 51 44.5 -325
Bank Nifty fut Long  25 10600 10575 -625
Bank Nifty 10600 PE Long 25 229 222 -175
M&M Long 50 725 730 250


Nifty Medium Term


Trend  Up
Initiation Date 12/06/2012
Initiated at  5116
High since change 5327
Reversal if closes below 5120


Thought for the day


The self is the friend of a man who masters himself through the self , but for a man who without self mastery , the self is like an enemy at war. - Bhagavad Gita.


Saturday, 7 July 2012

Market update for 09/07/2012


Nifty Hourly Chart


In this week market was extremely flat. Nifty is stuck in a range of 56 points that is between 5262-5318. Sectors like Telecom , Metals and Banks did well in this week.  Companies like Idea , Dish TV , United Spirits were the top gainers. Hexaware , Asian Paints and Wockhardt Ltd were the major Losers .

The trend of the Nifty is still up.If Nifty sustains below 5260 then we can see the levels of 5200. On the upside above 5320 target will be 5350-5400. One major event in this week is Infosys Q1 result which is on 12 th July.

Nifty Weekly Chart


On weekly chart Nifty has closed above 5300 which is 61.8 % retracement from the fall from 5626. Next target will be around 5400. Around 5400 there are multiple resistance like 100 WMA, 78.6% retracement levels and descending trend line drawn from 6330-5626. We can carry long position till 5400. My personal view is that 5400 could be the peak of this rally. Reversal of the trend will be closing below 5200.

Top pick of the week


Reliance Capital


Reliance Capital was one of the top gainers in last one month. Its upward trend started from Rs.298 and recently it made a high of Rs. 386. In the above chart you can see that is has reached a major resistance level which is at Rs. 375. Even though Rel Cap made a high of Rs.386 it couldn't sustain above this resistance level and weekly close is at Rs.374.50. Stochastics on weekly chart is overbought so the possibility of Rel Cap correcting is high. Traders can short Rel Cap around Rs370-375 for a target of Rs.350 and below. Stop loss will be  weekly closing above Rs.386. 

Open Positions


Scrip Type Qty  Price CMP P/L
Sesa Goa Long 100 206 198 -800
Nifty 5200 PE Long 50 51 34.3 -835
Bank Nifty fut Long  25 10600 10650 1250
Bank Nifty 10600 PE Long 25 229 186 -1075
M&M Long 50 725 732 350


Today's Trade


Scrip Qty Buy Price Sell Price P/L
Bharti  200 321.6 322 80


Nifty medium term trend


Trend  Up
Initiation Date 12/06/2012
Initiated at  5116
High since change 5327
Reversal if closes below 5120


Thought for the day


Employ your time in improving yourself by others men writing , so that you will gain easily for what others have laboured hard for - Socrates.