Monday, 16 July 2012

Market update for 17/07/2012


Nifty hourly chart


Today Nifty closed with moderate decline at 5197 down by 30 points. IT , metal , auto and capital goods sector lost significantly.

Nifty has closed below the previous trading sessions low and it has breached the psychological level of 5200. However it has bounced back from the previous resistance at 5190 which is an important support. 5190 is the last hope for bulls and below this level market may reach 5100 and much below.The short term trend remains down and reversal of the trend can happen only above 5260.

Nifty daily chart


In the last post it was indicated that 20 DMA at 5218 is acting as important support. Today Nifty has closed below this level indicating that bears are back. Closing below 5190 will take Nifty to 5100.

Chart of the day


LT has shown weakness by closing below the channel support. It has also closed below 20 DMA at 1485 and MACD is indicating downtrend. There is an intermediary support at Rs.1380 and once this level is breached LT can reach Rs.1360 levels. Reversal of the trend will happen if it closes above Rs.1400.

Open Positions


Scrip Type Qty  Price CMP P/L
Bharti 420 CE Short 1000 2.75 5.75 -3000
Nifty Fut Short 50 5250 5208 2100
Nifty 5300 CE Long 50 45 20 -1250
LT 1400 PE Short 250 22.35


Today's Trade


Scrip Qty Buy Price Sell Price P/L
Rel Infra 100 537.5 544 -650
LT 1400 CE 250 22.35


Nifty Medium term trend


Trend  Up
Initiation Date 12/06/2012
Initiated at  5116
High since change 5345
Reversal if closes below 5120


Results

Axis Bank , Bajaj Fin

 Thought for the day


Destiny is not a matter of chance , it is a matter of choice. It is not a thing to be waited for it is a thing to be achieved.


Competency Matrix

 The competency matrix reveals a process whereby individual progresses from one level of competence to another. The phase of the matrix as they apply to trading includes the following:

Unconscious incompetence stage
Conscious incompetent stage
Unconscious competent stage
Conscious competent stage


1. Unconscious incompetent stage: This stage describes a person who cannot trade successfully but doesn’t know it. Too many online traders fit into this category.

2. Conscious incompetent stage:  describes a person who cannot trade successfully and knows it!! . He should seek education and knowledge before proceeding.

3. The conscious competent stage: describes a person who can trade successfully by thinking about it and following a plan. Many have been confused into thinking they are in this phase when in reality they are experiencing luck in bull market.

4. Unconscious competent stage:  describes a person who can trade successfully and consistently on pure instincts. While mechanical knowledge is dynamic, it is likely that these people can reach and remain in this stage because they know themselves well and they understand the psychological influences on their thinking. This stage is the goal of every trader.
You are in which stage??

Sunday, 15 July 2012

Market update for 16/07/2012


Nifty Hourly chart


In the last trading session Nifty has closed at 5227 down by 8 points. It has sustained below 5260 which was earlier support for one more trading session.  Nifty reached an intraday high of 5265 but it couldn't sustain above 5260 and eventually closed in red.

From past two trading sessions the range of Nifty is 5218-5265. Intraday rally can be expected only if Nifty can sustain above 5265 or below 5218. The short term target for Nifty is 5200-5190 below this level Nifty can reach 5150.Reversal will be above 5300.

Nifty daily chart


On daily chart Nifty has showed a breakout from raising wedge and in the previous trading session MACD has also indicated a sell . From past two trading sessions Nifty has taken support at 5218 which is 20 DMA breaking this barrier is important for continuation of the down trend. On the other hand if Nifty bounces back it might face resistance at the previous high 5350. This is the region where lower part of the wedge is situated. So the expected range of Nifty is 5200-5350 and if Nifty manages to break any of these levels further continuation of the trend can be expected. Target will be 5100 or 5400.

Chart of the day

Tata Steel


Before two weeks Tata Steel had breached the important resistance at Rs.432. The importance of Rs.432 is very high as it had acted as both support and resistance many number of times in the past. After the breakout at Rs.432 it reached a high of Rs.455.

Tata Steel faced selling pressure at Rs. 455 which is nothing but descending trend line and closed at Rs.425 below 20 and 50 DMA in weekly chart. We can also notice that Tata Steel is in a bearish phase as it is forming lower top and lower bottom. Traders can sell Tata Steel between Rs.425-433 for a target of Rs.405-390. Reversal will be closing above Rs. 456. Time frame 15 days.

Open Positions


Scrip Type Qty  Price CMP P/L
Bharti 420 CE Short 1000 2.75 2.65 100
Nifty Fut Short 50 5250 5240 150
Nifty 5300 CE Long 50 45 35 -500


Today's Trades


Scrip Qty Buy Price Sell Price P/L
Sesa Goa 100 206 190 -1600


Nifty medium term trend


Trend  Up
Initiation Date 12/06/2012
Initiated at  5116
High since change 5345
Reversal if closes below 5120


 Results : Castrol , Exide Ind , Tata Coffee , South Indian Bank

Thought for the day


All the conceptions born of impatience and aimed at obtaining speedy recovery could only be gross errors. It was necessary to accumulate thousands of small victories to turn them into a great success.
General Vo Nguyen 1911

Thursday, 12 July 2012

Market update for 13/07/2012


Nifty hourly chart


Today Nifty has closed with significant losses. Nifty closed at 5235 down by 71 points. IT sector was the biggest loser. Infosys has disappointed the street and this has led to massive sell off . Infy closed at Rs.2264 down by 8.3%.

On hourly chart Nifty has come  out of the trading range 5260-5350. 5200 is  the short tern target and reversal will be above 5300. If Nifty closes below 5200 then we can expect further fall. 5260 was acting as support and Nifty was bouncing back from this level. Now 5260 can act as resistance.

Nifty Daily chart


Nifty had formed 'raising wedge pattern. The significance of today's trading session is high as Nifty has closed below the pattern. This is a break down. Nifty should come down to earlier resistance zone 5200-5190. Below this level the target will be 5100-5070.

Chart of the day


Bharti Airtel


Bharti was one of the major losers in today's trade. It closed at Rs.306.30 down by 3%. There are many indications which shows weakness in Bharti. Earlier Bharti closed above Rs.317 indicating a breakout. The breakout was short lived and it took a U turn closing below Rs.317. Closing below 100 DMA , below an ascending trend line and MACD  indicating a sell indicating that Bharti is a short sell candidate. There is a support at Rs.302-300. Below this level Bharti can come down to Rs.290. The reversal will be closing above Rs.322.

Open Positions


Scrip Type Qty  Price CMP P/L
Sesa Goa Long 100 206 193 -1300
Nifty Fut Short 50 5250 5247 150
Nifty 5300 CE Long 50 45 40 -250
Bharti 420 CE Short 1000 2.75 2.75 0


Today's Trade


Scrip Qty Buy Price Sell Price P/L
Infy 2500 CE 125 94 5 -11125
Infy 2500 PE 125 104.5 241 17062
Nifty Fut 50   5250  
Nifty 5300 CE 50 45    
Bharti 420 CE 1000   2.75  


Nifty Medium Term Trend


Trend  Up
Initiation Date 12/06/2012
Initiated at  5116
High since change 5345
Reversal if closes below 5120


Thought for the day


You can tell the character of every man when you see how he receives praise. Seneca


Wednesday, 11 July 2012

Market update for 12/07/2012


Nifty hourly chart


                                                      (click on the chart to enlarge)

In today's trading session Nifty has lost a major part of yesterday's gain. Nifty shut shop at 5306 down by 39 points. Realty , Metals , Oil and gas ,  power were the laggards in today's session. The ex breakout which happened  yesterday didn't act as a continuation pattern and we are ended up in consolidation region once again.

5260 is the strong support and any breakout from this level will take Nifty to 5200.

Nifty Daily chart


Even though the momentum is less and market is entering a narrow range there is no doubt that the trend is up. Nifty is taking support at lower part of the wedge and trying to reach higher levels. The trading range is getting narrower. I will not be surprised if Nifty bounces back tomorrow. Until Nifty is inside the wedge the trend will remain up. Supports for Nifty are available at 5290-5260 and 5200. Resistance is at 5350-5400.

Chart of the day


LT Weekly chart


Let me clarify  that at this point of time  LT is neither a buy nor a sell. Positional traders need to wait for two more days before taking any position in LT. The regular readers of this blog might have observed that  before 2 weeks we had recommended to buy LT at Rs.1375 for a target of Rs.1440 and today target is achieved.

LT can go up further if it closes above Rs.1420 on weekly basis. So wait for two more days on Monday if it is above Rs.1420 then again buy LT for a target of Rs.1480-1500 and stop loss will be closing below Rs.1370. Time frame at least 15 days. 

Infosys straddle


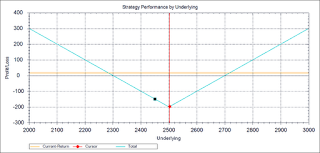
Straddle is one of the commonly used option trading strategy. This strategy is used when a trader is expecting a significant move in the index/stock but unsure about the direction.

Tomorrow Infosys is declaring its Q1 result and I have been observing that on the day of result Infy will be +/- 5% from previous close and some times 10% which depends on the news flow. So today we have suggested our subscribers to buy 2500 call option at Rs. 94 and 2500 put option at Rs.104.50. The pay off from this strategy can be observed in the below mentioned chart.


Total Investment 198.3
Total Debit 198.3
Profit Potential Unlimited
Max Loss 198.3
Lower BEP 2301
Higher BEP 2698


Open Positions


Scrip Type Qty  Price CMP P/L
Sesa Goa Long 100 206 200 -600
Infy 2500 CE Long 125 94 84 -1250
Infy 2500 PE Long  125 104.5 133 3562.5


Today's Trade


Scrip Qty Buy Price Sell Price P/L
SBIN 50 2243 2223 -1000
Nifty 5200 PE 50 51 21 -1500
Bank Nifty fut 25 10600 10750 3750
Bank Nifty 10600 PE 25 229 129 -2500
M&M 50 725 735 500
Tata Steel 65 443 437.5 -357


Nifty Medium Term Trend


Trend  Up
Initiation Date 12/06/2012
Initiated at  5116
High since change 5345
Reversal if closes below 5120


Thought for the day


Don’t ever average losses. Decrease your trading volume when you are doing poorly; increase your volume when you are trading well. Never trade in situations where you don’t have control.