Monday, 10 September 2012


Market updates for 11/09/2012


Nifty hourly chart


After a huge rally of 100+ points Nifty has started to consolidate in a narrow range. In hourly chart Nifty is in overbought region and MACD is showing signs of slow down in the momentum.Nifty is trading at 61.8% Fibonacci retracement from the fall of 5448 to 5216. The short term is still up but reversal may happen below 5280.
 

Nifty daily chart


Nifty has sustained the breakout from 5350 levels and now it is expected to move towards 5400 gradually. In short term Nifty may become range bound between 5280-5400 and this range may reduce as the time passes. In coming days there are major events like announcement of IIP data , Inflation , RBI monetary policy and others which will decide the trend of the market.
 

Nifty medium term trend

 
Trend  UP
Initiation Date 07/08/2012
Initiated at  5336
High since change 5448
Reversal if closes below 5180


Open Positions

 
Scrip Type  Price CMP P/L
Bank Nifty fut  Long 10140 10089 -51
Bank Nifty 10100 PE Long 153 168 15
V guard Long 410 396 -14
Bharti Long 256 261 5
JSW steel Fut Long 691 689.7 -1.3


Positions squared off

 
Scrip Buy Price Sell Price P/L
Nifty 5400 CE 44 46 2
LT fut 1348 1368 20


Thought for the day

 
The imagination of suffering is more painful that actual suffering.


Sunday, 9 September 2012


Market updates for 10/09/2012


Nifty daily chart


On previous trading sessions Nifty has managed to protect the support at 5220. Nifty made a big gap up open and  closed above 5300. On Saturday's special trading session resistance at 5350 was breached and now Nifty is likely to move up to 5400-5440.
 
In daily chart Nifty is forming higher high and higher low which is a bullish chart structure.Nifty has started another cycle of uptrend and this time  if it closes above 5440 then the target will be 5500-5600.  As long as Nifty is above the ascending trend line (marked in red) the short to medium term trend of Nifty will remain up. 
 

Nifty weekly chart


Nifty is facing resistance at 5400.It may not be possible to breach 5400 so easily as there are multiple resistances like 71.6% retracement of the fall from 5623-4764 and trend line resistance.Even though Nifty reached a high of 5448 the closing was below 5400. A weekly close above 5400 is required  to reach 5500 and 5600.
 

Nifty medium term trend

 
Trend  UP
Initiation Date 07/08/2012
Initiated at  5336
High since change 5448
Reversal if closes below 5180


Open Positions

 
Scrip Type  Price CMP P/L
Bank Nifty fut  Long 10140 10165 15
Bank Nifty 10100 PE Long 153 143 -10
V guard Long 410 403.5 -6.5
Bharti Long 256 254.5 -1.5
Nifty 5400 CE Long 44 48 4


Positions squared off 

 
Scrip Buy Price Sell Price P/L
ACC 1300 CE 31.5 65 33.5
ACC Fut 1299 1347 -48


Thought for the day

 
You aren't wealthy until you have something money can't buy


Thursday, 6 September 2012


Market updates for 07/09/2012


Nifty hourly chart


In hourly chart Nifty is closed above the descending trend line which was acting as resistance. First target in short term is 5277. Once this level is breached we can expect 5330-5350. Reversal of the trend will be below 5215. Technical indicators like MACD and RSI are indicating buy and we can expect recovery as long as Nifty is above 5200.

Nifty daily chart


Nifty has once again managed to hold 5200. There are multiple support around 5200 and since RSI is over sold downside seems to be limited. Important resistance levels are 5300-5350.
 

Nifty medium term trend

 
Trend  UP
Initiation Date 07/08/20122
Initiated at  5336
High since change 5448
Reversal if closes below 5180


Open positions

 
Scrip Type  Price CMP P/L
ACC 1300 CE Long 31.5 53 21.5
ACC Fut Short 1299 1338 -39
V guard Long 410 403.5 -6.5
Bharti Long 256 252 -4


Positions squared off

 
Scrip Buy Price Sell Price P/L
Nifty Fut 5245 5291 46
Nifty 5300 CE 77.5 55 -22.5


Thought for the day

 
If you realise how powerful your thoughts are you will never think a negetivee thought.


Wednesday, 5 September 2012


Market updates for 06/09/2012


Nifty hourly chart


Nifty has closed below 5250 which was an important support. Nifty shut shop at 5225 down by 48 points. Today's fall was lead by banks , metals and auto sector.
 
In hourly chart Nifty has formed a wedge formation and the trading range is becoming narrow gradually . Breakout from this range may happen in one or two trading session. Wait for the breakout to happen.
 

Nifty daily chart


Nifty has closed near major support at 5220. This is a 'make or break' situation. So far Nifty has formed higher high higher low formation in daily chart. If the trend line support is breached then Nifty may fall atleast till 5130 which is 200 DMA.
 

Nifty medium term trend

 
Trend  UP
Initiation Date 07/08/20122
Initiated at  5336
High since change 5448
Reversal if closes below 5180


Open positions

 
Scrip Type  Price CMP P/L
ACC 1300 CE Long 31.5 33.5 2
ACC Fut Short 1299 1302 -3
V guard Long 410 409 -1
Nifty fut Short 5291 5252 39
Nifty 5300 CE Long 77.5 57 -20.5


Positions squared off

 
Scrip Buy Price Sell Price P/L
Britannia 486 504 18
 

Thought for the day

 
If you have the courage to begin you have the courage to suceed.


Market updates for 05/09/2012


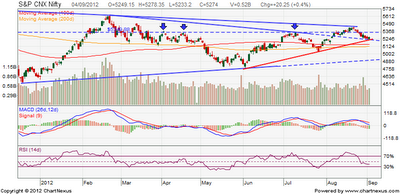
Nifty has once again tested 5250 by making intraday low of 5234. Traders should note that supports and resistance are temporary in nature. If the prices of and underlying asset is reaching the support/resistance again and again then they will fall apart.
 
Nifty has made an intraday bounce back and closed at 5276 up by 23 points. At 5276 it is facing a trend line resistance in hourly chart. Short term trend of the market is down and reversal will be above 5350.
 

Nifty daily chart


Nifty is consolidating in a narrow region by keeping 5250 as support and at the same time it is facing selling pressure around 5300. The expected short term target is 5250-5220.
 

Open positions

 
Scrip Type  Price CMP P/L
Britannia Long 486 504.4 18.4
V guard Long 410 407 -3
Nifty fut Short 5291 5301 -10
Nifty 5300 CE Long 77.5 81.5 3.5


Positions squared off

 
Scrip Buy Price Sell Price P/L
IDFC fut 130 133 3
IDFC 130 CE 6.65 4.6 -2.05
Infy 2300 PE 27.5 24 -3.5


Nifty medium term trend

 
Trend  UP
Initiation Date 07/08/20122
Initiated at  5336
High since change 5448
Reversal if closes below 5180